

When to Sell
Weekly BriefJuly 10, 2024•5 min read
Since the stock market bottomed on October 14, 2022, the major indices have rallied significantly. During these past 20 months, the tech-based NASDAQ index has soared 78.3% followed by a large-cap S&P 500 index up 55.53%. The mid-cap S&P 400 index and small Cap S&P 600 trailed, rising 29.42% and 18.22% respectively.
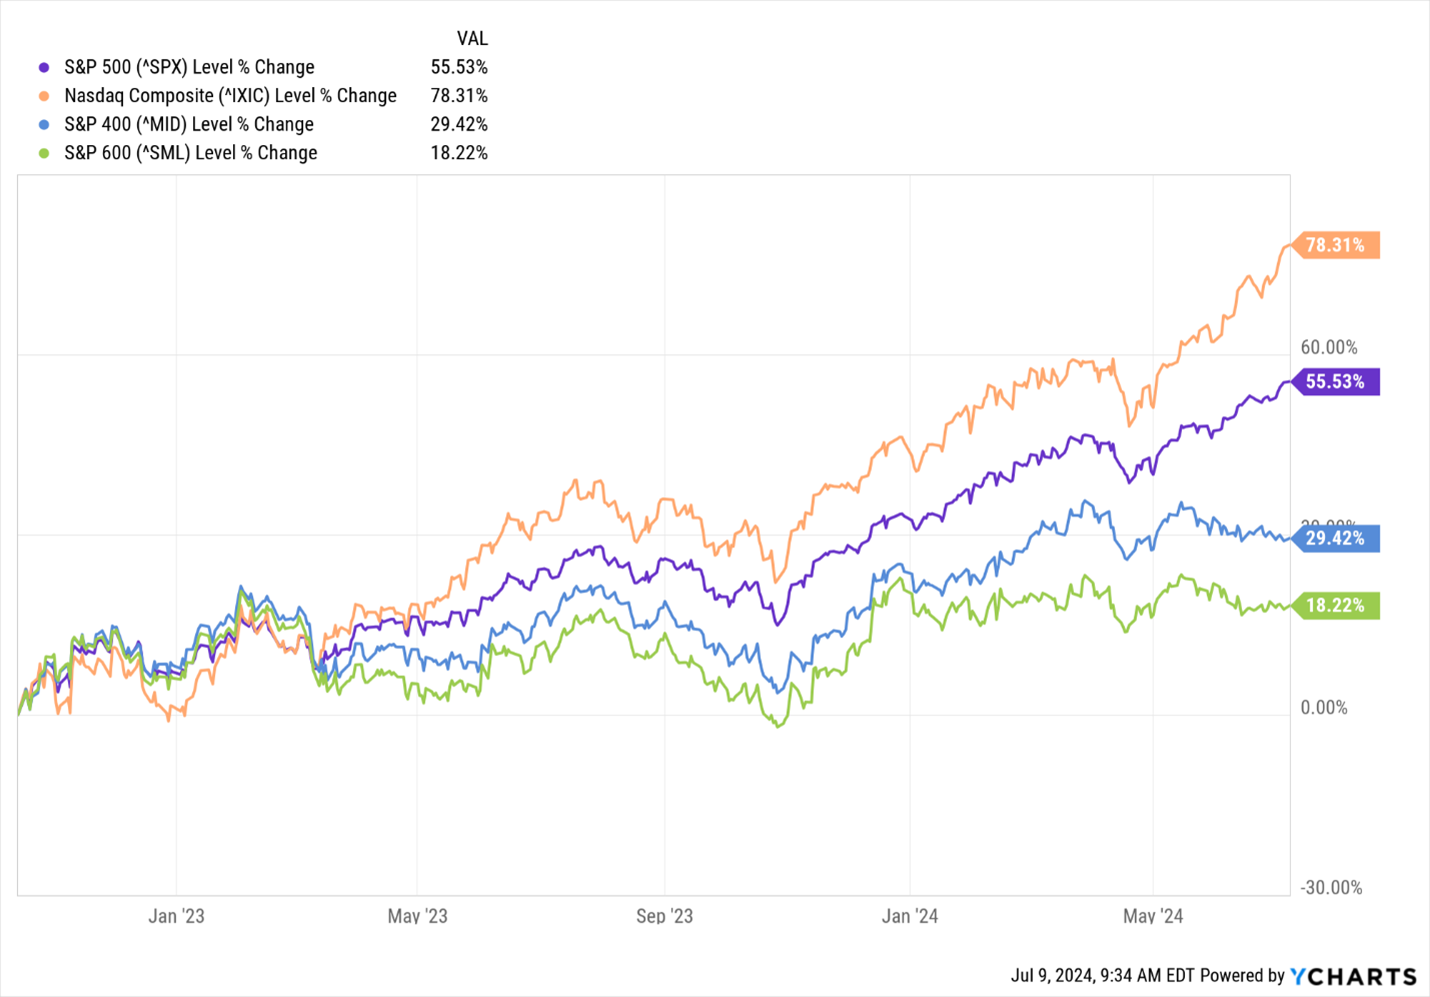
During this rally, we have overweighted Exchanged Traded Funds (ETF) of both S&P 500 and NASDAQ while underweighted ETFs of mid and small-cap indices in our model portfolios – an allocation we have recommended several times in this Weekly Update.
Last week we wrote about the booming AI industry and specifically about Nvidia’s (NVDA). Since we added NVDA to our Growth & Income and Growth models on February 1, 2023, the stock is up 521% for our clients.
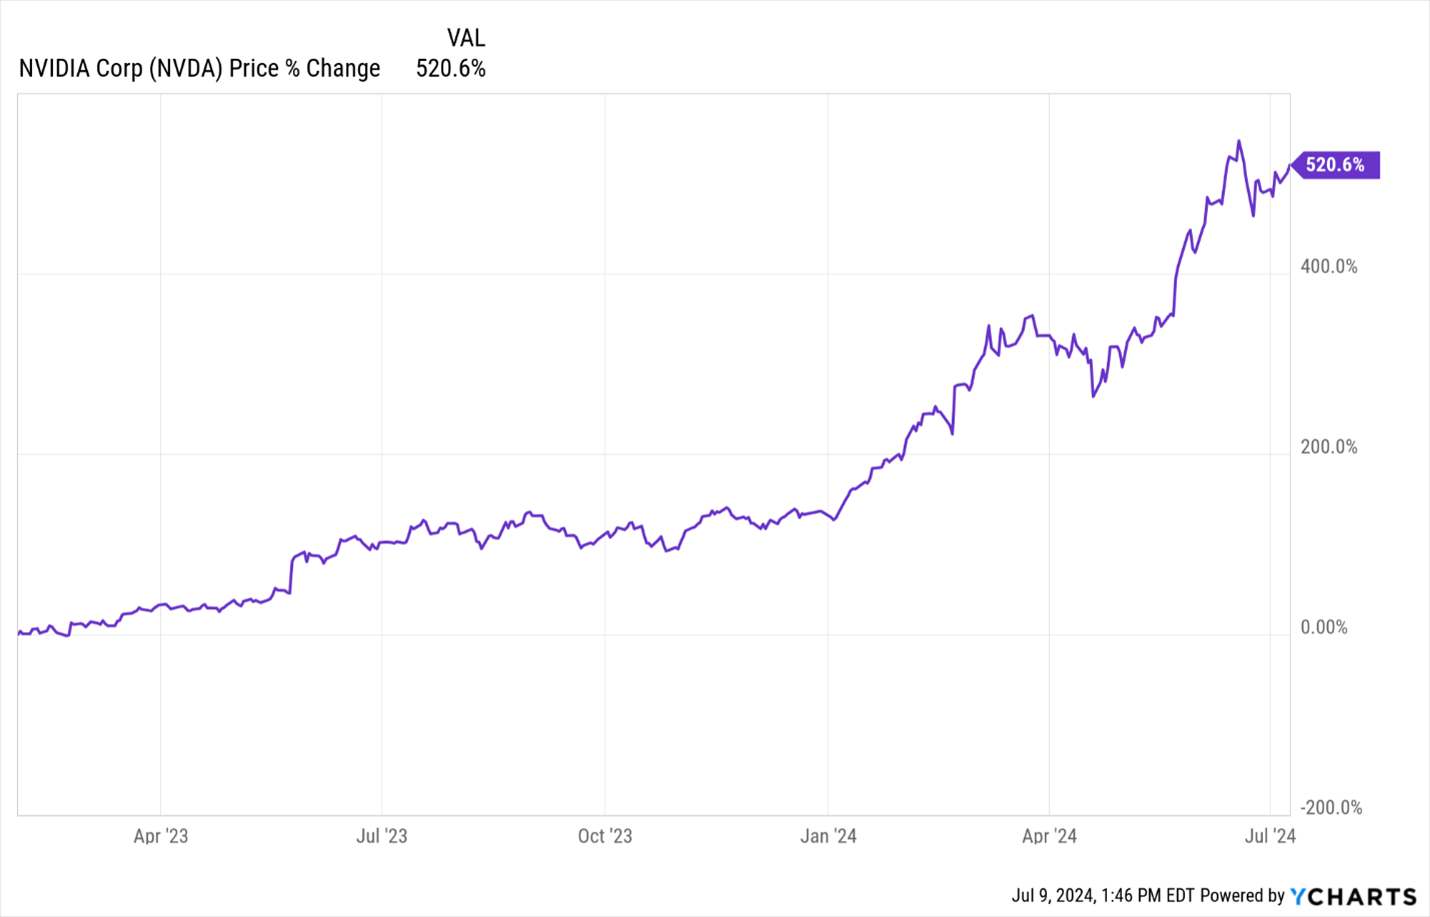
NVDA is one of many positions doing well in our model portfolios along with the overall performance of the major US indices.
Needless to say, with these terrific returns, clients are getting nervous and asking, “When should we sell?”.
Good question and the topic of this Weekly Update.
There are many indicators we monitor to determine when market conditions, individual stocks, or sectors are weakening. Our methodology to determine when to buy or sell incorporates both the analysis of fundamental and technology data that should collaborate in the trading strategy.
As a case study, we will focus on Home Depot.
We started adding Home Depot (HD) to our model portfolios in the first quarter of 2012. We based our decision on the fundamentals of an improving housing market following the 2008 Great Recession. The S&P 500 index had bottomed in March 2009 from the Great Recession and the housing market recovery took a year or so to restart. By mid-2010, home builders were initiating new housing developments and homeowners had returned to the marketplace. By the end of 2011, new developments were popping up around the country, and buying activity in single-family residential was steadily improving.
Considering the technical aspects of HD, the stock had increased about 118% from early March 2009 through 2011, and by January 2012 the stock was well above its 50 and 200 Day Moving Averages (DMA).
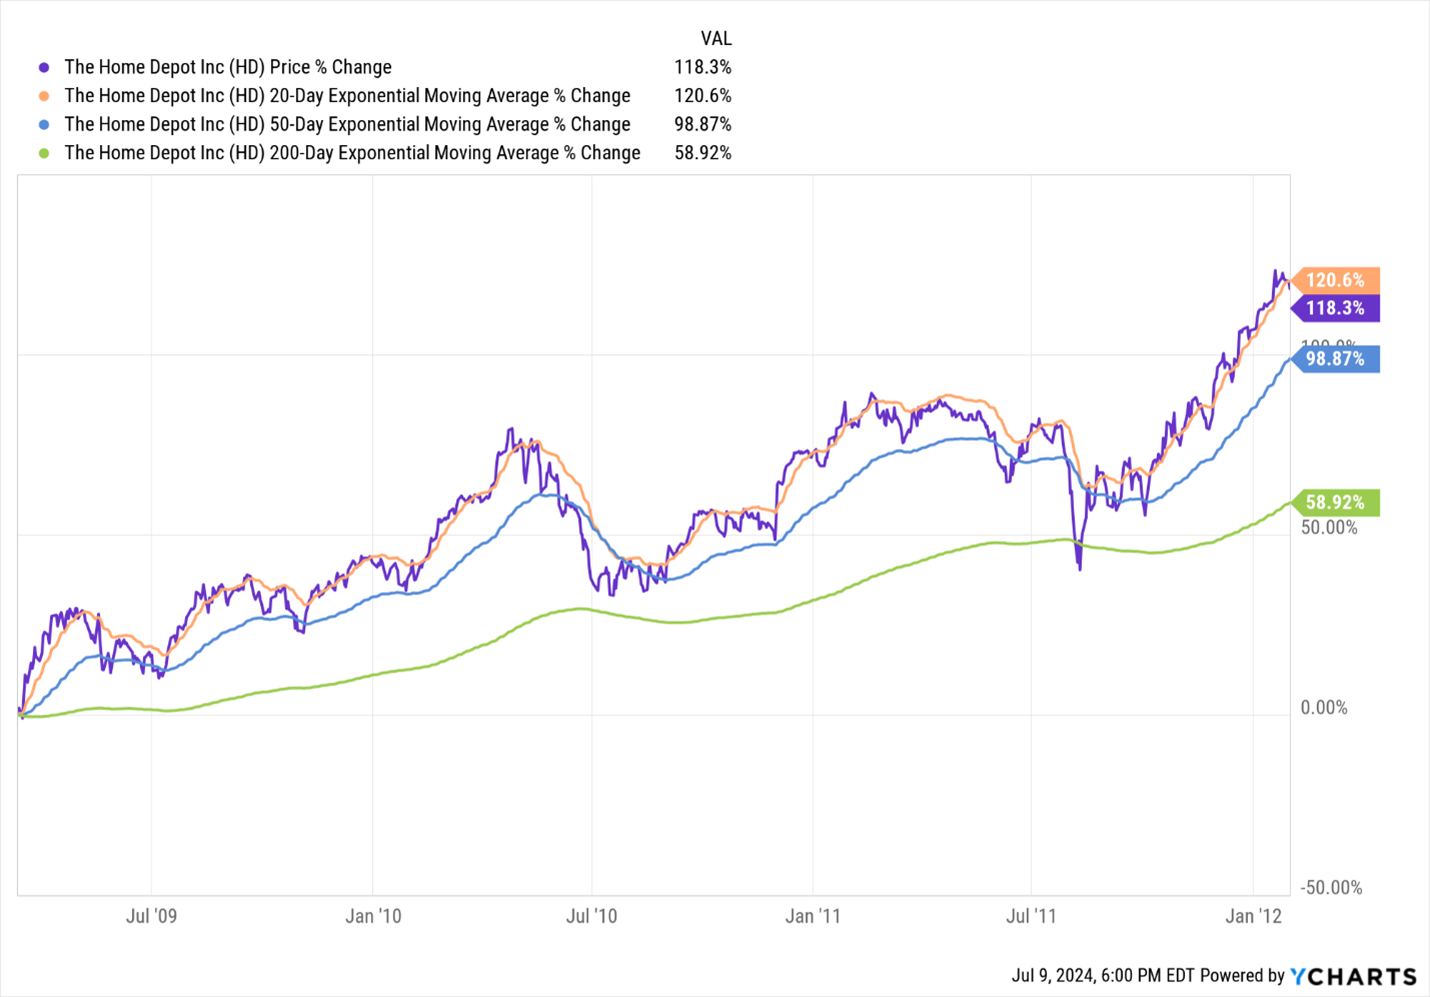
We like real estate and I have decades of experience owning, developing, and managing residential and commercial properties. After the residential crash that impacted almost every aspect of the economy, it is very typical after such a crash like in 2008 for a strong rebound and sometimes equally or greater than the prior crash. With growing evidence of a housing recovery, we started adding housing stocks to our model portfolios that include home builders such as Toll Brothers (TOL), Pulte Homes (PHM), and Lennar (LEN). We liked HD as the building supplier to home developers and homeowners along with their seasonal retail products for holidays.
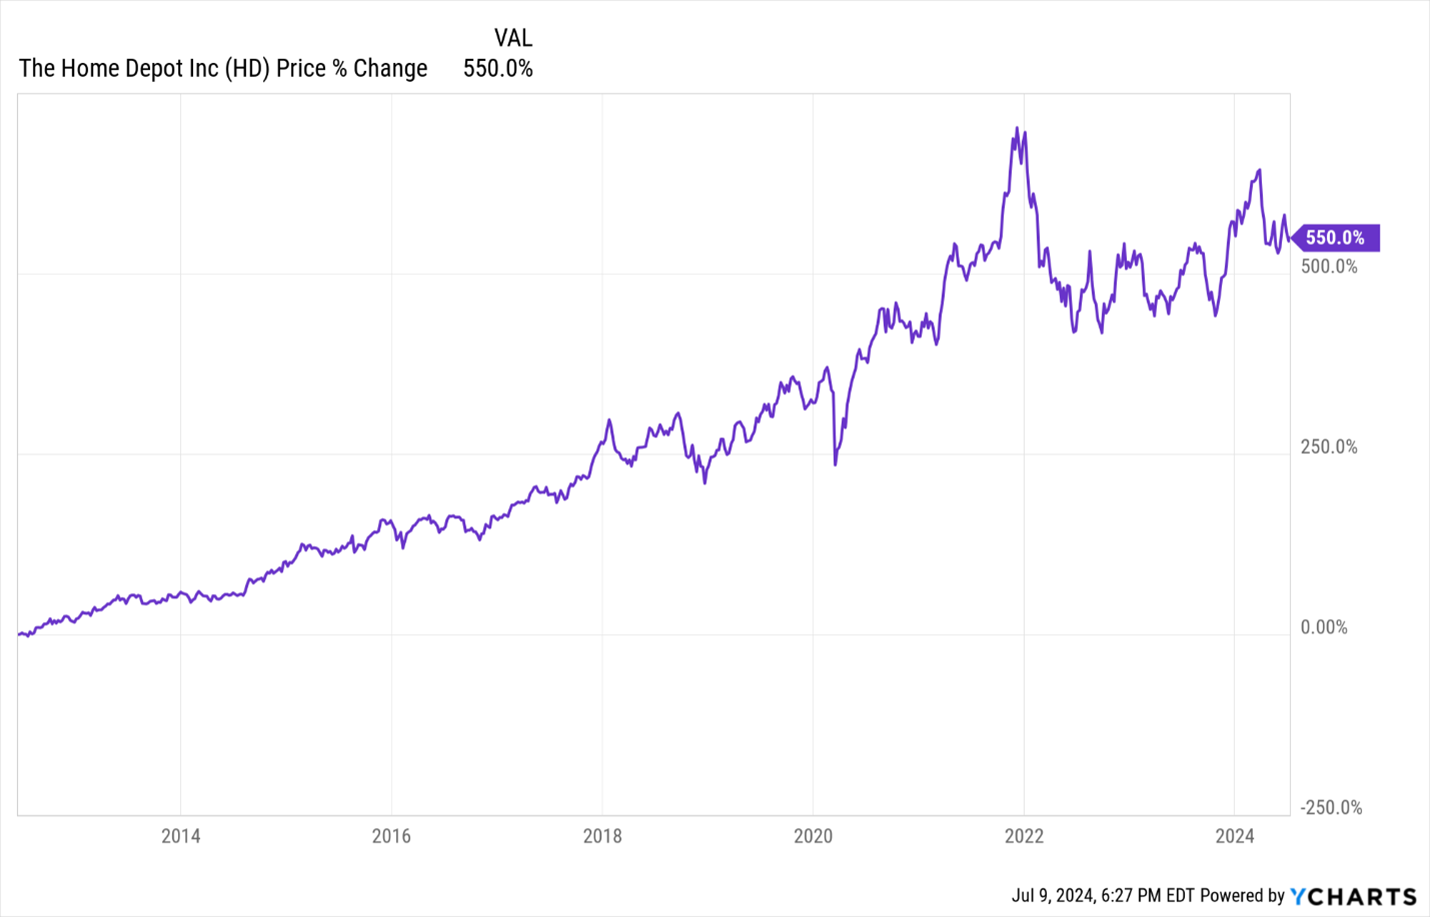
We concluded that both fundamental and technical indicators were positive to begin adding HD to our model portfolios in the second quarter of 2012. Our projections were a possible long positive uptrend for HD in sales and profits. We were correct and the stock rallied 550% until we began selling it on June 3, 2024.
WHY WE SOLD HOME DEPOT
The residential real estate industry got a jolt of activity due to Covid. Residential property values soared from 2020 to 2021 as people relocated or bought bigger homes thanks to historically low fixed mortgage rates. Builders stepped up their pace of launching new developments to meet the expanding demand for those moving to the suburbs. All was well until March 2022 when the Federal Reserve announced its aggressive rate hike campaign to slow the nearly double-digit annualized rate of inflation. In a few months, the residential and refinance industry came to a halt and by mid-2023 the transaction activity of house sales was at historical lows. The fundamentals for builders and suppliers were detrimentally impacted with 6% and 7% mortgage rates and weakening every day as interest rates stayed at these levels. Technically, HD stock peaked on December 10, 2021, at $415 per share and has not recovered since. For most of 2023, the stock traded in a flat range and ended the year with a mild rally that continued into early 2024. This rally stalled on March 22, 2024, well below its previous high, and closed today at $337.13 down 18.8% below its December 10, 2021 closing price.
We surmised that both fundamental and technical indicators collaborated that the industry and Home Depot were weakening and may not recover for one or more years.
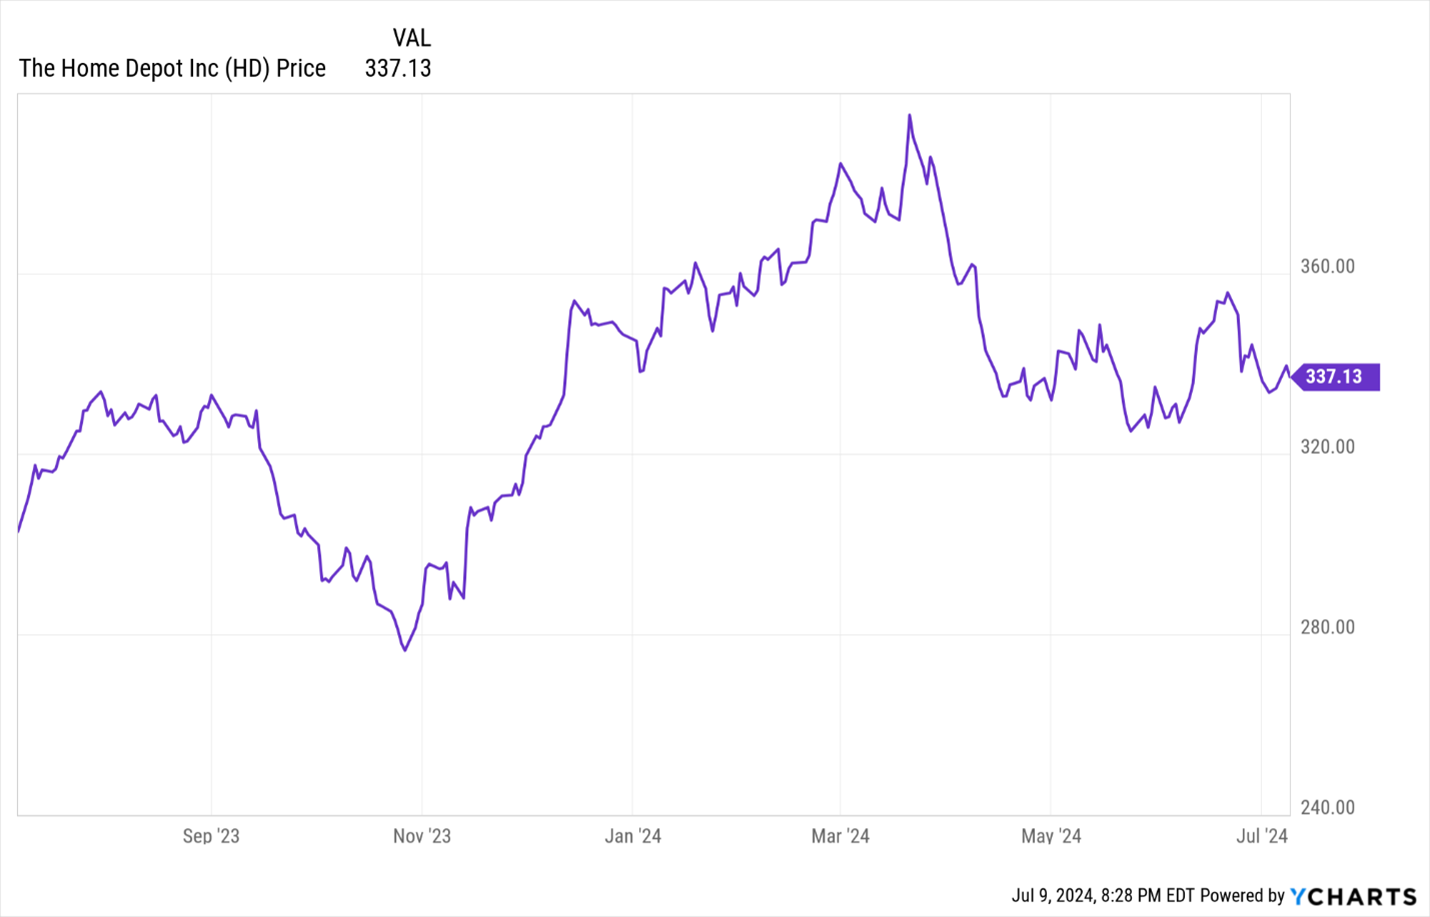
This same scenario plays out for rising and falling trends for most other industries and economies. The collapse in 2008 was years in the making with lots of red flags to indicate a growing bubble. I wrote in our March 2006 issue of “Managing to Retire” Newsletter of the increasing signs indicating a 2008 recession. I didn’t realize the recession would become the “2008 Great Recession” but glad we began increasing our cash positions starting in late 2007.
What Does This Mean to Me?
Stock market and economic crashes do not happen without reason and typically prior to several years of developing factors that result in reversing a positive trend. Currently, we maintain our positive view of the overall US stock market and economy. Our view is the same for the technology and AI industry. However, it’s not if but when the economy and technology industries will begin to weaken and indicate signs to start to sell. This is not to be confused with short-term contractions or selling periods during a growth cycle. Investors typically take profits that bring stock prices down temporarily. In fact, it is rare for stock prices to trade higher every day for weeks or months. Normal trading activity is two steps forward and one step back during up cycles and the reverse during down cycles. It is healthy for stocks to fluctuate during upward trends as dips offer new buying opportunities that can propel the stock and market to new higher levels.
Let us know what you think of this Update. We welcome the opportunity to assist you and your family with your financial goals.

Anton Bayer
Back to Blog