
As we noted last week, Kevin Warsh, the new Chairman of the Federal Reserve, has returned the Federal Open Market Committee (FOMC) to a less transparent communication policy regarding the future direction of interest rates. This will make it harder for investors and analysts to predict future changes in interest rates.
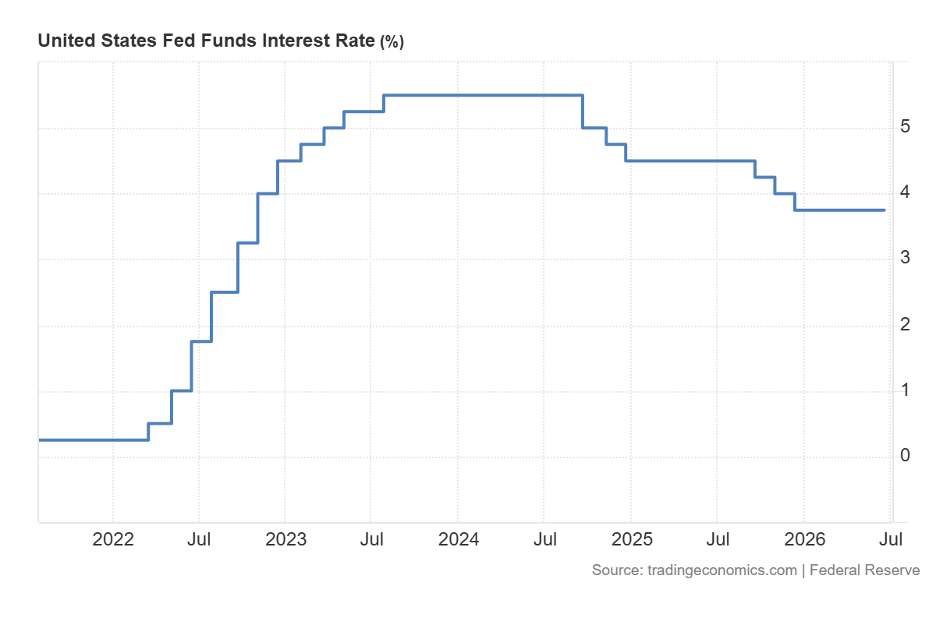
Borrowing costs for consumers and businesses are a major influence on U.S. economic growth. Former Federal Reserve Chairman Jerome Powell initiated an aggressive interest-rate increase campaign in 2022 to prevent inflation from developing into a prolonged cycle similar to the high-inflation environment of the 1970s. As a result, the FOMC aggressively raised its target range for the federal funds rate from 0% to 5.5% in 16 months. This dramatically increased banks’ funding costs and contributed to higher interest rates across nearly every lending category, including mortgages, auto loans, credit cards, and business loans.
One important sector impacted by rising interest rates is the housing market. Residential housing activity has remained sluggish since late 2022, following the dramatic rise in interest rates. The chart below shows US Housing Starts since 2019 as reported by the Census Bureau. On the chart is an orange line highlighting March 2022 when the FOMC began its interest rate hike campaign. Housing starts peaked that month with 1.82M annualized new housing starts that the industry has not repeated since.
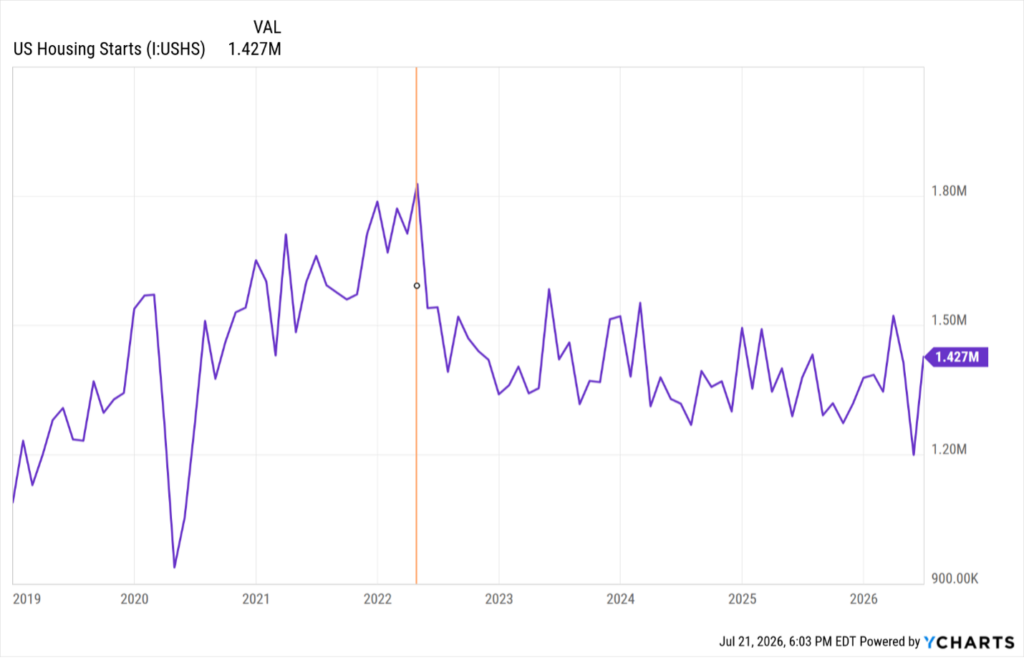
Last week, the Census Bureau reported that U.S. housing starts jumped 19% in June 2026 to a seasonally adjusted annual rate of 1.427 million units, significantly exceeding market forecasts. However, the unexpected surge was driven primarily by a volatile 76.3% spike in multi-family starts, whereas single-family starts edged down 0.2%.
During Mr. Warsh’s July 14 testimony before the House Financial Services Committee, he predictably offered little indication of the FOMC’s future interest-rate policy. However, Mr. Warsh specifically stated the FOMC will “have no tolerance for persistently elevated inflation” while declining to explain what specific policy actions the Committee might take to restore price stability. Throughout the nearly three-hour hearing, he repeatedly criticized the Federal Reserve for allowing inflation to remain above the Committee’s 2% annual target.
Investors are concerned that an unexpected rate increase later in 2026 could slow economic growth and weaken corporate earnings.
With the FOMC providing less forward guidance, investors and analysts will increasingly rely on economic indicators to anticipate the direction of interest rates. One key direct indicator of inflation is the change in import and export prices, which can provide early indications of future costs for U.S. consumers. Unfortunately for American businesses, year-over-year changes in import prices have generally fluctuated more widely than U.S. export prices since 1985, with the notable exception of May 2021 through June 2023. This volatility creates challenges for companies attempting to manage costs, set prices, and consistently increase revenue and profits.
The chart below compares the year-over-year movement of import and export prices.
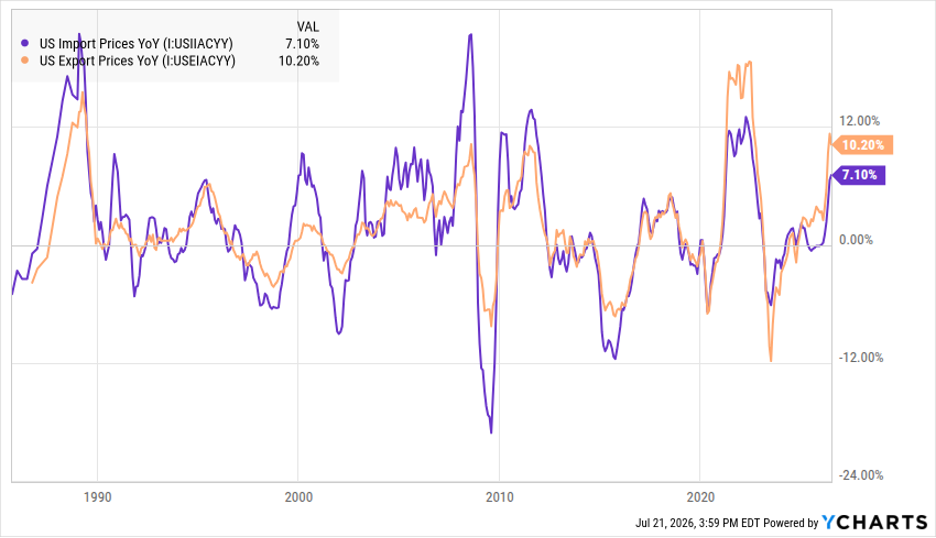
It would be reasonable to blame elevated inflation on the conflict with Iran and the subsequent rise in oil prices. However, according to Friday’s Bureau of Labor Statistics’ (BLS) report on US Import and Export Price Indexes, there is more to the story than high oil prices. The BLS report begins with overall changes in import costs stating,
“Prices for U.S. imports rose 0.3 percent in June following increases of 1.7 percent in May and 2.1 percent in April. U.S. import prices advanced 7.1 percent from June 2025 to June 2026, the largest over-the-year increase since the index rose 7.7 percent in August 2022.”
Regarding fuels, the report outlined how significant the category of fuel costs has risen stating,
“Fuels and lubricants import prices decreased 0.4 percent in June following an increase of 12.6 percent in May. The June decline for import fuels and lubricants prices was the first monthly drop since the index fell 1.2 percent in January. In June, lower prices for import petroleum more than offset higher prices for import natural gas. Prices for import petroleum declined 0.7 percent in June and import natural gas prices increased 9.2 percent over the same period. Fuels and lubricants import prices increased 44.1 percent from June 2025 to June 2026. The price index for import petroleum increased 45.4 percent over the past 12 months and prices for import natural gas advanced 92.9 percent over the same period.”
Despite the significant rise in fuels, June’s 7.1% YoY increase in import prices appears mild. However, costs for all items excluding fuels are also increasing, albeit at a much slower rate, and well above the FOMC 2% annual target rate. For the category of all items excluding fuels the BLS reported,
“Prices for nonfuel imports increased 0.4 percent in June following an advance of 0.7 percent in May. In June, higher prices for nonfuel industrial supplies and materials; capital goods; and consumer goods, excluding automotives, more than offset lower prices for automotive vehicles, parts, and engines as well as foods, feeds, and beverages. Nonfuel import prices rose 4.2 percent from June 2025 to June 2026, the largest 12-month increase since the index rose 4.6 percent for the year ended June 2022.”
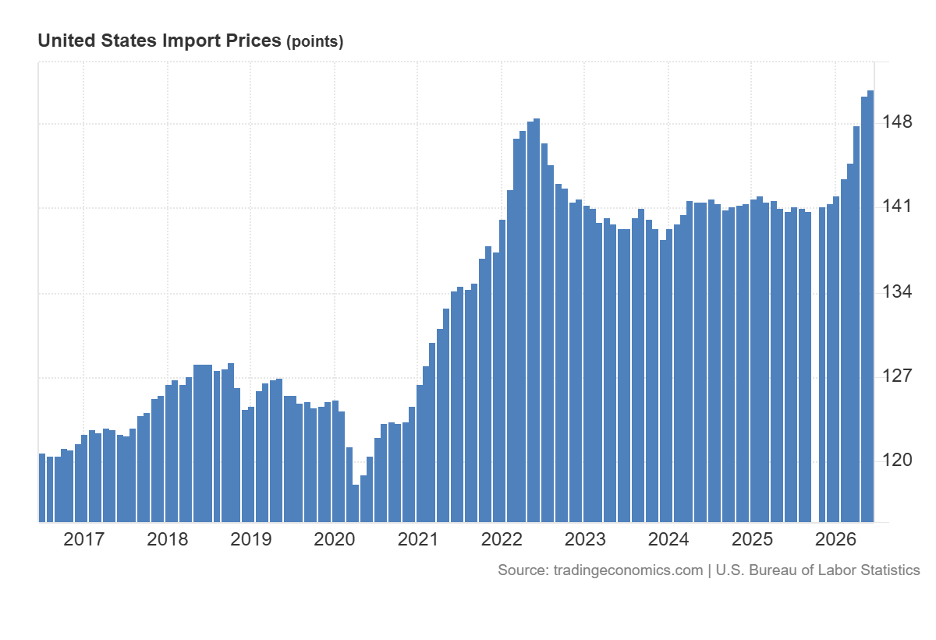
Below is a chart of US import prices since 2016. Prior to the pandemic, import price changes were manageable for American businesses. After bottoming in mid-2020, they soared and remain near all-time highs.
What does this mean to me?
Investors have reason to be concerned about volatile import costs and the possibility that the Federal Reserve may raise interest rates later this year. If import costs continue to increase, businesses may pass those additional expenses on to consumers through higher prices. Persistent inflationary pressure could then prompt the FOMC to raise interest rates in an effort to slow demand and restore price stability.
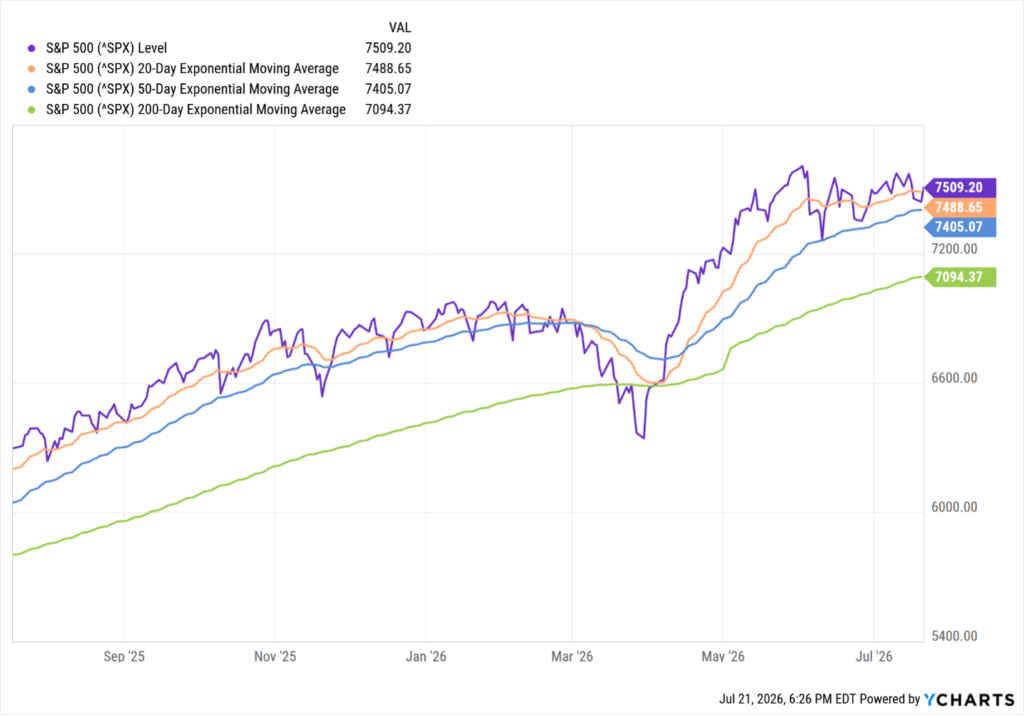
Investor uncertainty has been evident in the prolonged stall of the S&P 500 since June 1. The index is now below its 20-Day Moving Average (DMA) and approaches its 50 DMA and remains 5.5% above its 200 DMA.
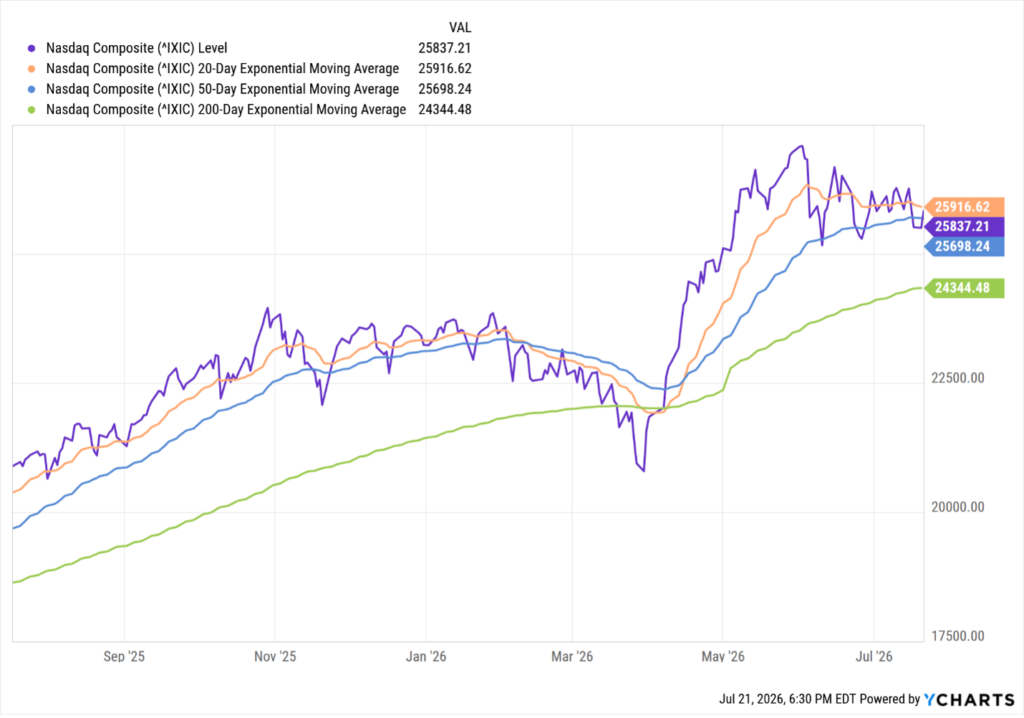
The prolonged stall has also affected the tech-heavy NASDAQ. Since June 1, the NASDAQ has fallen below its 20 DMA and 50 DMA and remains 6% above its 200 DMA.
We maintain our favorable outlook for the U.S. economy and stock market. Institutional investment managers and their analysts do not appear overly concerned about the risks of rising inflation and interest rates. Therefore, we see no reason to reduce equity exposure in response to the market’s recent period of limited movement.
Earnings reports from several key companies this month should provide additional insight into the outlook for corporate growth during the remainder of the year. Currently, we are maintaining our current portfolio allocations, consistent with the apparent positioning of institutional investors.
Up Capital Management, Inc. is an investment adviser registered with the U.S. Securities and Exchange Commission (SEC). Registration does not imply a certain level of skill or training. This commentary is provided for informational and educational purposes only, reflects the opinions of the author as of the date of publication, and is subject to change without notice. It is not intended as personalized investment, tax, or legal advice, and no statement herein should be construed as a recommendation to buy, sell, or hold any security or to adopt any particular investment strategy. Readers should consult their own adviser regarding their individual circumstances.
Certain statements, including references to the firm’s outlook and portfolio positioning, are forward-looking and based on current expectations. Actual events and results may differ materially. Economic data referenced herein is sourced from the U.S. Bureau of Labor Statistics, the U.S. Census Bureau, and other third parties believed to be reliable, but accuracy and completeness cannot be guaranteed. The S&P 500 and NASDAQ Composite are unmanaged indices that cannot be invested in directly, and their performance does not reflect the deduction of advisory fees or other expenses. References to moving averages are technical observations, not predictions of future performance. Past performance is no guarantee of future results. Investing involves risk, including possible loss of principal.