
Many of our clients substantially increased their net worth during pivotal periods of their lives by concentrating their capital in one or a small number of investments. For some, this meant investing heavily in their own business, holding a significant position in their employer’s stock, or acquiring real estate. For others, it was their primary residence, which appreciated considerably in high-growth markets, or, more recently, fast-appreciating technology stocks.
However, many clients who benefited from significant asset appreciation can no longer maintain the same level of concentration. The original opportunity may no longer exist because the business or property was sold, or their current financial circumstances may make continued concentration inappropriate.
Concentrating wealth in one or a few assets creates the potential for both exceptional returns and substantial losses. During a strong growth cycle, a concentrated investment can soar in value and dramatically accelerate wealth creation. However, if conditions change, that same concentration can expose an investor to devastating losses.
Concentration can be an effective strategy for building wealth, but diversification becomes increasingly important for protecting it.
For investors approaching retirement, or reaching a stage when preserving wealth becomes a priority, the challenge is to develop a strategy that allows their assets to continue growing ahead of inflation and taxes while reducing the risk of substantial losses and wide fluctuations in account value.
In this UPdate, we will outline a few strategies designed to help accomplish both objectives.
Reduce Concentrated Positions
When we lived in the San Jose area during the 1990s, we witnessed firsthand both the benefits and the risks of employees holding nearly all their savings in their technology company’s stock.
For many, their concentrated stock portfolio developed through multiple financial mechanisms. Many technology companies matched 401(k) contributions in company stock, and employee stock purchase plans let workers buy discounted shares through payroll deductions, typically 10 to 15% below market price, with required holding periods.
Early employees of emerging technology companies received stock options with very low exercise prices. When these companies went public, the resulting gains created extraordinary wealth. During the 1990s, new millionaires were seemingly minted every week as the value of their technology stock holdings soared in price.
We worked with many individuals whose substantial net worth was almost entirely attributable to one company’s stock. Although they were excited about their newfound wealth, some were understandably concerned that they could lose it as quickly as they had accumulated it.
I say “some” because many believed their stocks would continue doubling indefinitely. They were unwilling to consider that a rapidly appreciating technology stock could decline sharply, or worse, that the company could enter bankruptcy. Fear of missing out, or FOMO, prevented them from reducing their concentrated positions and protecting a portion of their gains.
The dramatic appreciation of their stock also created significant unrealized taxable gains. To avoid selling shares and paying capital-gains taxes, many borrowed against their stock holdings to purchase homes, travel, and finance other lifestyle expenses. They may have believed they had discovered a clever way to “have their cake and eat it too.”
This strategy worked as long as the stock continued appreciating or at least maintained its value. However, borrowing against a concentrated stock position introduced another layer of risk. If the stock declined substantially, the collateral value also declined and the investors could face margin calls, forced sales, a large tax liability, and the rapid destruction of wealth that had taken years to accumulate.
These circumstances contributed to a compounding cycle of wealth destruction that began in early 2000. We met and worked with many people whose net worth had soared during the technology boom, only to see much, or even all, of that wealth disappear within a few short years.
The consequences were especially painful because the prolonged stock market decline coincided with widespread corporate downsizing and business failures. Some investors watched their concentrated stock holdings collapse at the same time they lost their jobs and primary source of income. By the time the market finally bottomed in late 2002 and early 2003, millions of investors had suffered devastating financial losses.
Today’s market environment has many similarities to the late 1990s. Investors holding technology stocks, particularly companies connected to artificial intelligence, have experienced extraordinary gains during the past several years. This new market leadership has expanded beyond AI software companies to include semiconductor and digital-memory manufacturers.
During the 12 months through August 3, 2026, Sandisk’s stock price soared approximately 3,300%. That remarkable increase dwarfed the already substantial gains of Micron Technology (+750.0%), Western Digital (+616.7%), Advanced Micro Devices (+203.7%), and Alphabet (+96.6%).
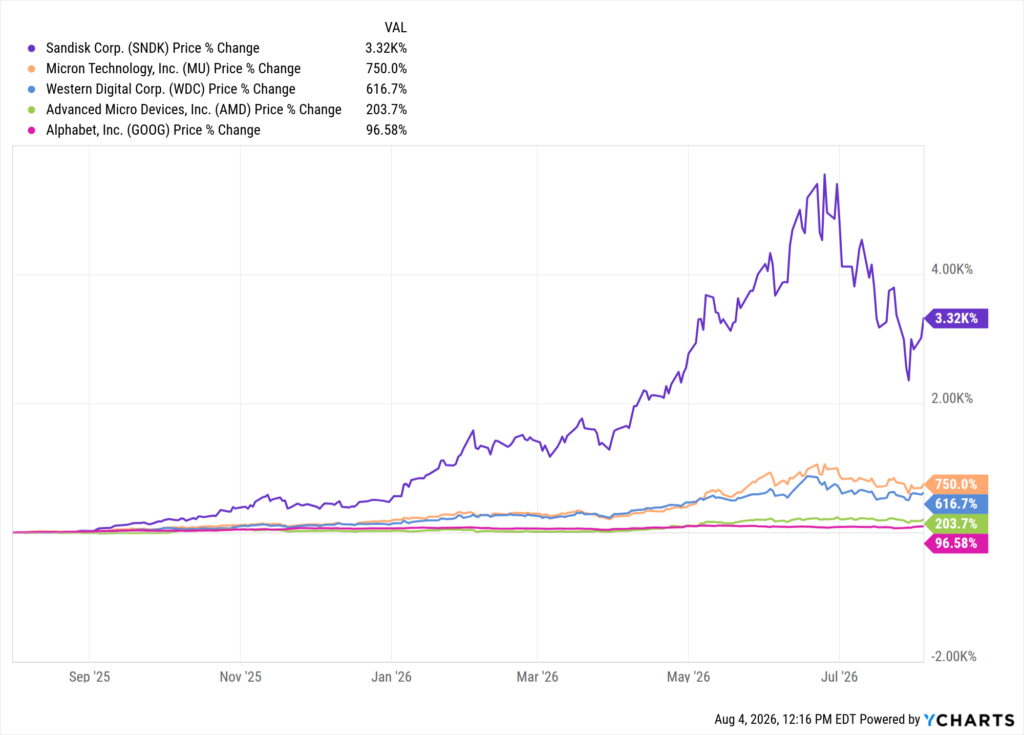
However, as the chart above illustrates, a stock that rises rapidly can also decline just as quickly. After its extraordinary advance, Sandisk’s share price fell more than 39% in only 30 days, from June 25 through July 29, 2026.
The lesson may appear obvious in hindsight: Investors with a large concentration in a single stock, industry, or asset class should develop an exit strategy before suffering a devastating loss. Investors who diversified a portion of their technology stock holdings before the bubble burst preserved wealth that many of their peers lost.
Developing an effective exit strategy begins with a comprehensive financial plan that clearly defines the investor’s goals, timeline, income needs, and long-term objectives. Selling a highly successful and rapidly appreciating stock also requires a disciplined strategy that considers tax liabilities, the appropriate timetable for reducing the position, and the amount of loss the investor can afford to absorb.
One of the most important components of this process is determining the minimum annualized return and year-end investment values required to support the investor’s desired lifestyle and eventual estate distributions to beneficiaries. These benchmarks establish a financial glide path and help define how much volatility or loss can be tolerated before the concentrated position begins jeopardizing the investor’s long-term goals.
The objective is not necessarily to sell the entire position at once or identify the stock’s exact peak. It is to systematically convert a portion of the wealth created through concentration into a diversified portfolio capable of preserving that wealth and supporting the investor’s future financial needs.
Portfolio Diversification
As discussed above, a diversified portfolio can help reduce volatility and produce a smoother pattern of investment returns. The Asset Class chart below identifies each asset class by color and ranks them according to their annual returns dating back to 2011.
You will notice that the best-performing asset class changes in most years. The chart also shows that an asset class near the bottom of the rankings can gradually move higher and eventually become a market leader. This pattern demonstrates the normal process of market rotation, as previously underperforming asset classes recover and emerge as the new leaders in investment returns.
Because no single asset class consistently remains at the top, maintaining exposure across multiple asset classes can help investors participate in changing market leadership while reducing the risks associated with concentrating too heavily in one area.
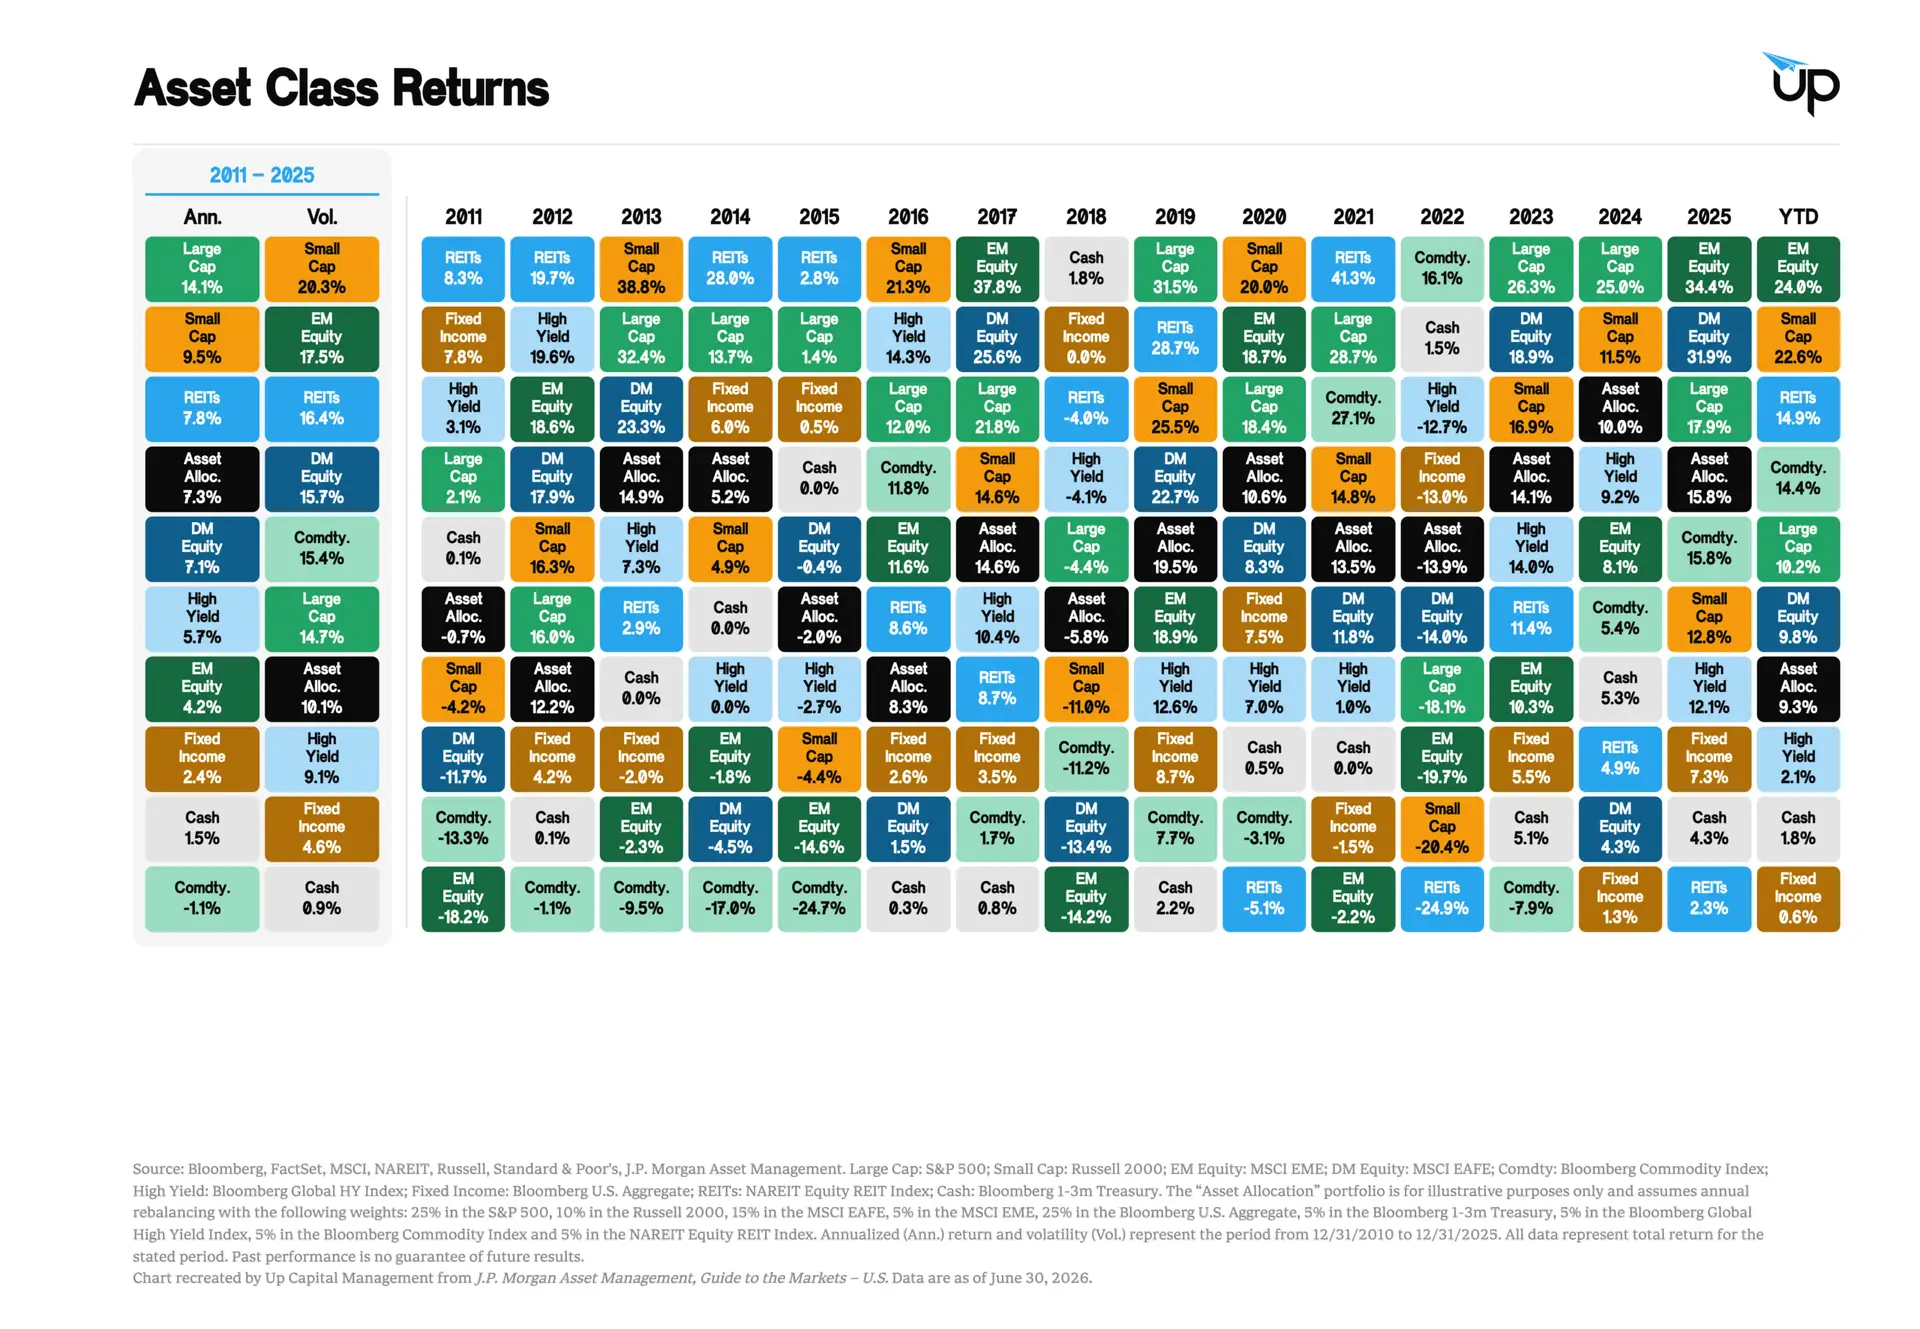
What we want you to notice are the black boxes representing a diversified growth & income portfolio. This portfolio, rebalanced annually, represents an allocation of:
25% S&P 500
10% Russell 2000
15% MSCI EAFE
5% MSCI Emerging Markets
25% Bloomberg US Aggregate Bond
5% Bloomberg 1-3 Month US Treasury (cash)
5% Bloomberg Global High Yield Bond
5% Bloomberg Commodity Index
5% NAREIT Equity REIT (Real Estate)
You will notice that the diversified portfolio is never the best- or worst-performing allocation on the chart. Instead, its position demonstrates the relative consistency of its annual returns.
The portfolio’s strongest years generally coincided with periods of strong stock market performance. In 2013, for example, small-cap stocks were the top-performing asset class, gaining 38.8%. The diversified portfolio gained 14.9% that year, among its strongest results of the period.
The portfolio’s worst year was 2022, when the Federal Reserve began aggressively raising interest rates to slow inflation. Although the diversified allocation declined 13.9%, its loss was considerably smaller than the 24.9% decline in REITs and the 20.4% decline in the small-cap index. This illustrates how diversification may not eliminate losses during broad market declines, but it can help reduce their severity.
When preparing financial plans for our clients, one of our primary objectives is to determine the minimum pretax annualized investment return required to achieve their lifetime goals. In many cases, the required return is less than 6%, a rate that a properly constructed diversified portfolio should reasonably target over a long investment horizon.
Investment Tier Strategy
We address these competing objectives by creating a tiered investment strategy consisting of multiple accounts with different levels of risk, liquidity, and growth potential.
Although many of our clients have already “won the game” by achieving financial independence, they do not want to pass up attractive investment opportunities or leave too much of their money in low-interest-bearing accounts. At the same time, they do not want to jeopardize the financial security they worked so hard to achieve.
The first tier is a conservative income portfolio composed of liquid, lower-risk investments. It is generally designed to fund 12 to 24 months of anticipated withdrawals and living expenses. The remaining assets are allocated to portfolios with greater long-term growth potential and an appropriate level of market risk.
The illustration below shows how this cash-flow strategy works. The income account provides monthly distributions and serves as a financial buffer, allowing the growth portfolios to remain invested during market downturns. This reduces the likelihood that growth assets will need to be sold at depressed prices to meet routine income needs.
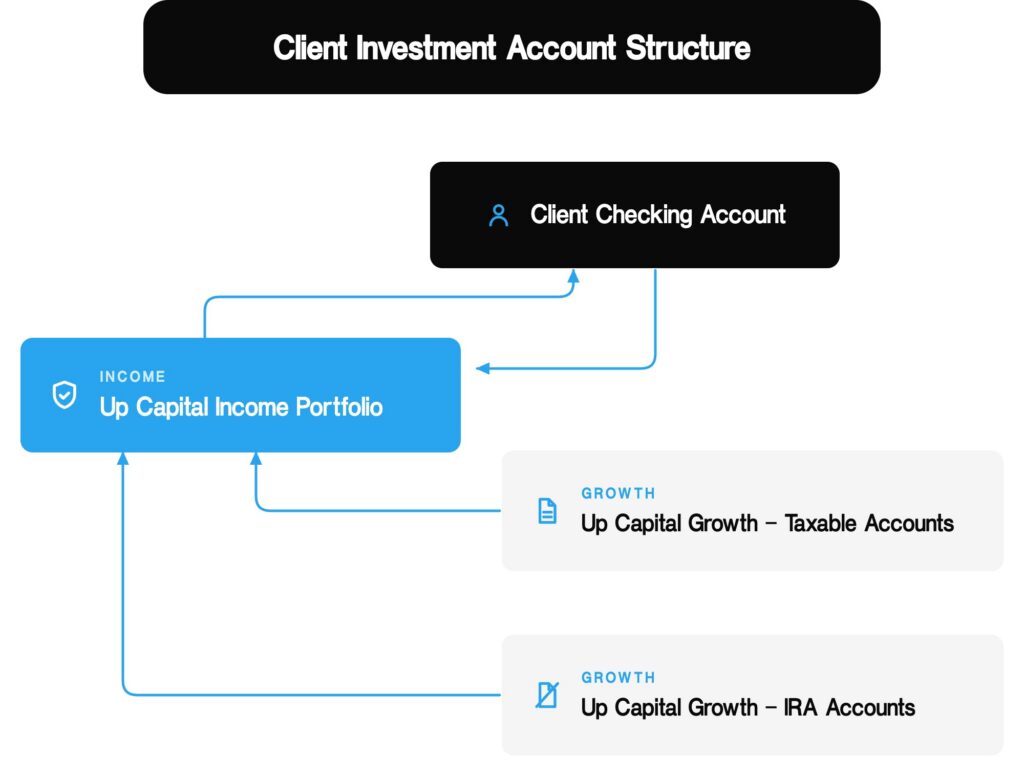
The objective is to maintain sufficient liquid assets to fund monthly withdrawals during recessions, market corrections, and other periods of declining investment values.
During the past 26 years, U.S. market downturns have varied considerably in length. The longest was the prolonged dot-com bust of 2000 to 2003, which lasted approximately 36 months. Others, like the tariff-driven decline in the spring of 2025, reversed within weeks. Because the duration of a downturn cannot be predicted in advance, a key component of this strategy is maintaining enough conservative assets to cover approximately 12 to 24 months of anticipated income needs. This reduces the risk of having to sell growth investments at depressed prices.
When market conditions improve and the growth portfolios recover, gains can be strategically realized and transferred to replenish the conservative income account. This disciplined process allows the investor to raise cash when market conditions are favorable rather than being forced to sell during a downturn.
What does this mean to me?
The past three years have produced exceptional gains in the technology sector. It is not unusual for investment portfolios to become highly concentrated as the best investments outperform the other holdings and become a larger portion of the account. If investors have also allocated funds to tech-focused Exchange Traded Funds (ETFs), the result may be a high concentration in one asset class that moves together with market changes.
We are addressing high concentration now so investors can apply the lessons of the 1990s. There are strategies to diversify a portfolio allocation without entirely compromising its growth potential. More importantly, should the tech and AI sectors experience a significant “dot-com” type bust, the diversification may limit the financial impact.
Let us know your thoughts on this UPdate completing this quick form. We welcome your comments and the opportunity to discuss your financial plan and how we can assist you and your family in achieving your financial goals.
If more than a third of your net worth sits in one stock, one property, or one sector, that’s worth a conversation. Start here.