
After a robust recovery that began on April 1, technology stocks finally experienced a modest selloff this past week. While the headlines may feel unsettling, the recent decline appears more like a normal pause within an ongoing Growth/Expansion cycle than the beginning of a major market downturn.
As discussed in prior UPdates, market advances rarely move in a straight line. Following substantial gains, investors often lock in profits, rebalance portfolios, and rotate capital into sectors that have lagged the market leaders. This rotation is a healthy characteristic of a functioning market and helps prevent excessive speculation from building unchecked.
Market cycles also tend to follow historical patterns. As we enter the third quarter, the stock market is approaching what has traditionally been the weakest period of the calendar year. Since World War II, the S&P 500 has generated its lowest average quarterly return during the third quarter. Seasonal weakness alone, however, has never been a reliable predictor of a bear market. More often, it creates opportunities for investors willing to focus on fundamentals rather than short-term headlines.
Today, many of the key indicators we monitor remain constructive. Corporate earnings continue to grow, unemployment remains relatively low, consumer spending remains healthy, and institutional investors continue to deploy capital across many sectors of the market. While concerns surrounding inflation, tariffs, geopolitical tensions, and government policy remain ever-present, the underlying economic data continues to support a stable environment for businesses and consumers.
Last Friday, investors reacted negatively to a surprisingly strong employment report. The U.S. economy added 172,000 nonfarm jobs during May, significantly exceeding expectations of approximately 80,000 new jobs. In other words, nearly 92,000 more Americans found employment than economists had anticipated.
Normally, strong job growth would be welcomed news. However, investors have become increasingly focused on the timing of future Federal Reserve interest rate cuts. A strong labor market suggests the economy remains healthy and reduces the urgency for the Federal Reserve to lower rates. As a result, investors sold stocks aggressively, particularly high-growth technology companies that tend to benefit most from lower borrowing costs.
NASDAQ declined 4.2%, its worst single-day decline since April 2025, while the S&P 500 fell 2.6%, marking its largest one-day decline since October 2025. By the close of trading, approximately $1.8 trillion in market value had been erased from U.S. equities (1).
Despite the sharp decline, the market’s response this week may provide insight into investor sentiment heading into the summer months. Stocks rebounded modestly on Monday, and although sellers returned on Tuesday morning, major indexes recovered much of their losses by the close of the day. This type of back-and-forth trading is often characteristic of investors searching for direction after a strong rally.
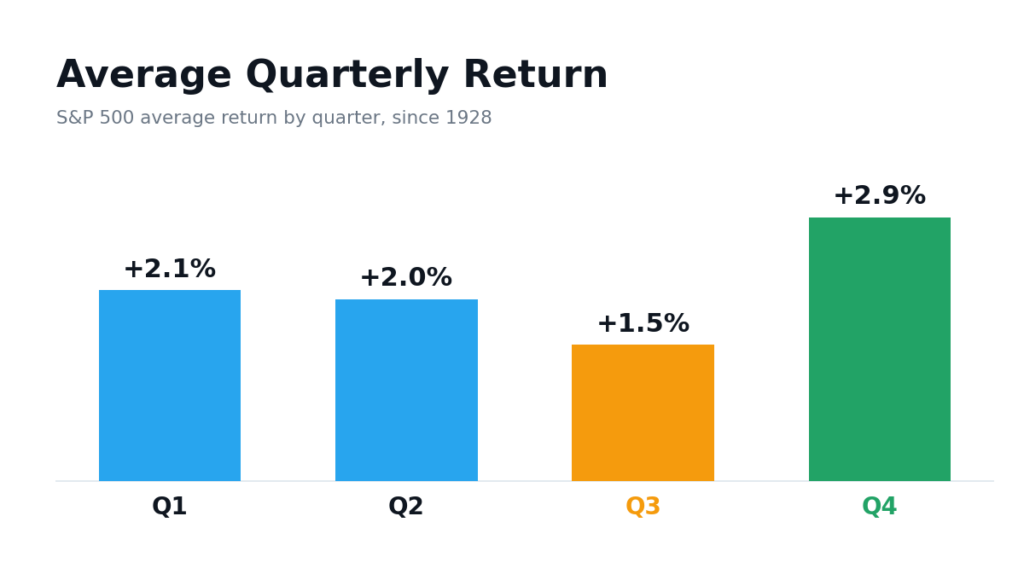
As mentioned, the third quarter has historically been the weakest period of the year for stocks. Since World War II, the S&P 500 has produced an average gain of approximately 1.5% during Q3, compared to nearly 2.9% during Q4. Much of this seasonal weakness is attributable to August and September, with September historically being the only month of the year to produce a negative average return.
The chart below illustrates the average quarterly performance of the S&P 500 since 1928. While the third quarter has historically produced the smallest gains, it has often served as a period of consolidation before stronger fourth-quarter advances. In fact, the average Q4 gain has historically been nearly twice that of Q3.
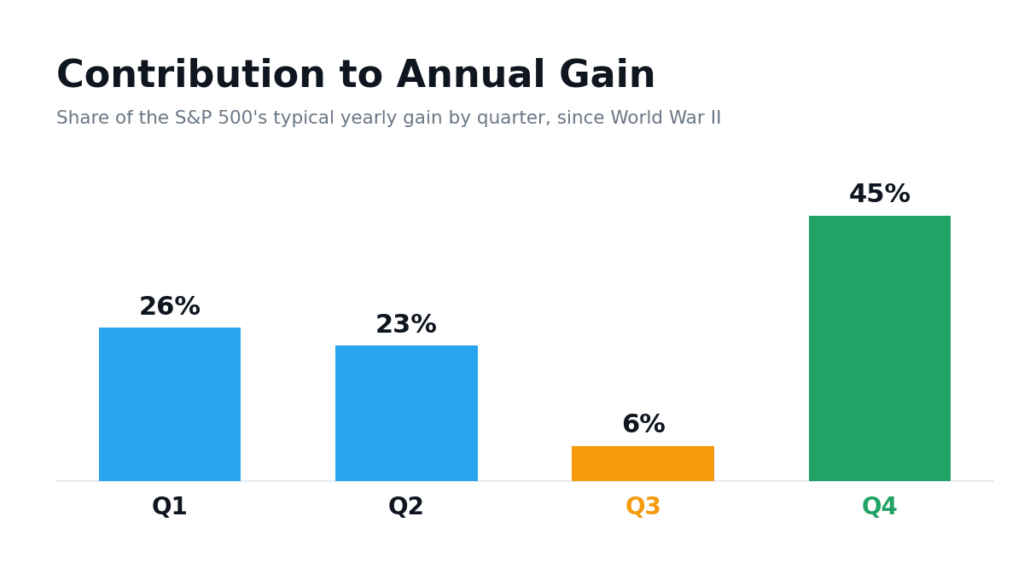
The average annual contribution by each quarter is more revealing. Since WWII, the average contribution to the year’s gain by quarter was best achieved during the 4th quarter, which on average is responsible for 45% of the year’s gain. While the third quarter contributes only 6% of the year’s gain. Below is a chart of how much the year’s total return is earned during each quarter. Data via Bespoke Investment Group.
For long-term investors, seasonal weakness should not be feared. Instead, it should be viewed as a normal and healthy component of market cycles. While volatility may increase during the summer months, periods of weakness often create opportunities to add to high-quality investments, rebalance portfolios, and position for the next phase of the market’s advance.
Seasonal trends are interesting, but they should never be viewed as a forecast. Economic growth, corporate earnings, interest rates, and investor sentiment ultimately drive stock prices. History simply reminds us that periods of weakness during the third quarter are common and frequently provide attractive entry points for disciplined investors focused on long-term results. This can be especially beneficial for participants in 401(k) and other retirement plans who continue investing every two weeks through payroll contributions. Market volatility allows these investors to purchase additional shares at lower prices, potentially enhancing long-term returns through dollar-cost averaging.
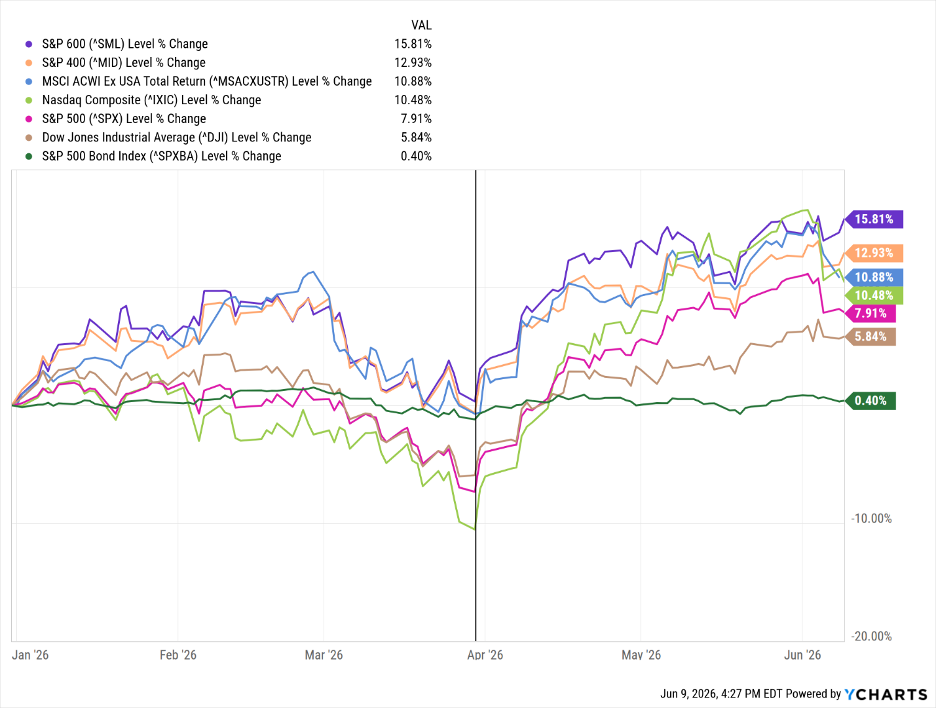
Since April 1, as indicated by the vertical line on the chart below, the major market indexes have staged an impressive recovery. More importantly, leadership has broadened beyond the mega-cap technology stocks that have dominated returns for much of the past decade. The strongest performance has come from small- and mid-cap companies, a trend we anticipated earlier this year.
Since I have identified that the current Growth/Expansion cycle began in 2014, investors have navigated a steady stream of concerns including trade disputes, inflation, rising interest rates, geopolitical conflicts, banking crises, pandemics, and repeated predictions of recession. Despite these challenges, the U.S. economy has continued to expand, corporate earnings have generally trended higher, and the stock market has rewarded patient investors who remained focused on their long-term objectives.
Our investment focus remains unchanged. We continue to seek companies and sectors demonstrating sustainable growth in revenue and profits, supported by increasing investor demand. While market corrections and seasonal weakness can be uncomfortable, they frequently create attractive opportunities for disciplined investors willing to look beyond short-term headlines and focus on long-term trends.
For investors, periods of seasonal weakness can offer two distinct benefits. First, they may provide opportunities to purchase shares of quality companies at more attractive prices. Second, they allow investors to rebalance portfolios by trimming positions that have become overweight and reallocating capital toward sectors and companies showing improving fundamentals and earnings trends.
What Does This Mean to Me?
History suggests investors should not be surprised by a possible period of weakness during the summer months. In fact, many strong fourth-quarter advances have been preceded by periods of consolidation during the third quarter. While no historical pattern guarantees future results, seasonal softness often helps reset investor expectations, reduce excessive optimism, and create the foundation for the next advance.
The “Summer Sale” may be underway. For long-term investors, that is not necessarily bad news. Temporary declines can create opportunities to accumulate quality investments, particularly for retirement savers who continue contributing to their accounts every pay period regardless of market conditions.
We continue to maintain our favorable outlook on the U.S. economy and stock market. Corporate earnings remain healthy, consumer spending continues to support economic activity, and market leadership has broadened beyond a handful of large technology companies. These are constructive characteristics that have historically supported sustainable market advances.
If you have questions about the market, your investments, or your financial plan, complete this form to get in touch. We welcome the opportunity to assist you and your family in achieving your financial and personal goals.
(1) Adinolfi, J., & Gottsegen, G. (n.d.). S&P 500 sees $1.8 trillion wipeout, Nasdaq tallies biggest point drop on record: What investors need to know about Friday’s selloff. Market Watch. https://www.marketwatch.com/story/s-p-500-sees-1-8-trillion-wipeout-nasdaq-tallies-biggest-point-drop-on-record-heres-what-investors-need-to-know-about-fridays-selloff-4eb7b490