

Stock Market Deja Vu!
Weekly BriefOctober 09, 2024•4 min read
We have warned at the end of the strong first half of 2024 that a summer selloff is not unusual. Not only are selloffs and market corrections typical, but they are also necessary to extend a positive growth trend of stock values. Experienced portfolio managers wait for weak market cycles during established growth trends to rebalance their portfolios and look for new buying opportunities. We did the same.
As a review, the S&P 500 had another solid first half of 2024 increasing 14.48% from January to June 30, 2024. During the summer selloff, the index lost 43% of the year’s gain bottoming on August 5. Since then, the index has had a steady positive trend to recover to close at all-time highs. Today, the S&P 500 is up 20.57% YTD.
Below is a YTD chart of the S&P 500 that illustrates the index is back above its 20, 50, and 200-day moving averages (DMA). More importantly, there is the stacking of the DMA with the 20 DMA above the 50 DMA which is above the 200 DMA. This is a typical bullish (positive) trend formation that indicates the index (purple line) is increasing faster than the past 20-day average trend (orange line). The 20-day trend is increasing faster than the 50-day trend (blue line) which is increasing faster than the past 200-day trend (green line). In short, the index momentum is increasing faster every day since breaking above the 20 DMA on August 15.
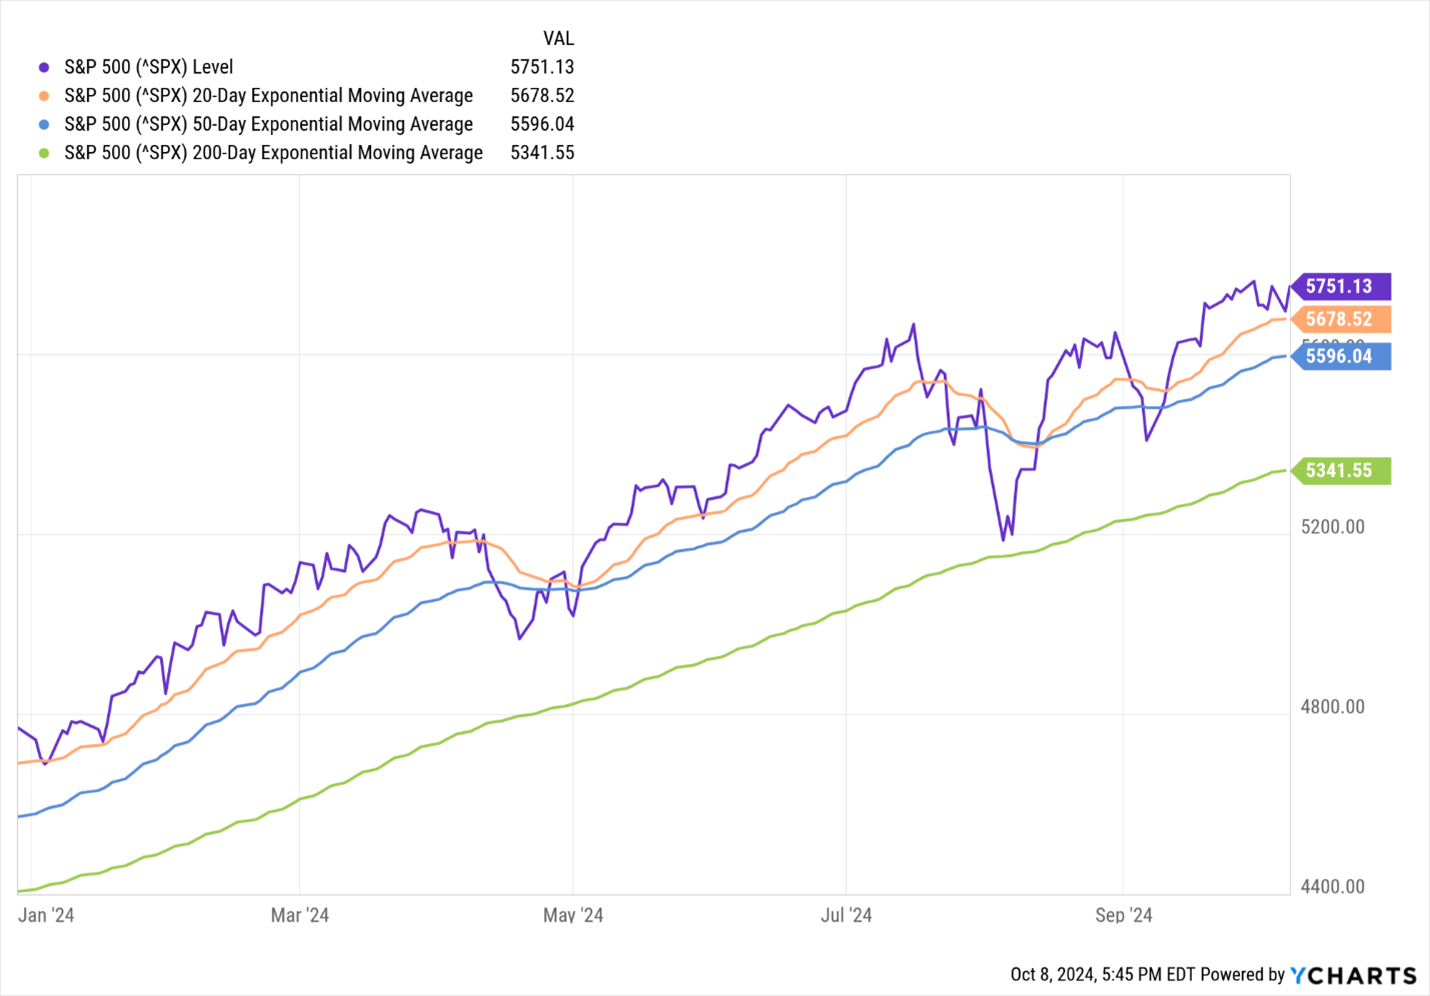
This is good news as the index is already at new all-time highs and may continue this positive trend going into the fourth quarter.
2024 is looking a lot like 2023 Deja vu. The index and overall stock market had a strong first half of 2023 increasing 15.91% from January to June 30, 2023. Then the summer selloff ensued losing almost 50% of the year’s gain bottoming on October 27 to rally 17% to close the year with a 24.23% gain for the year.
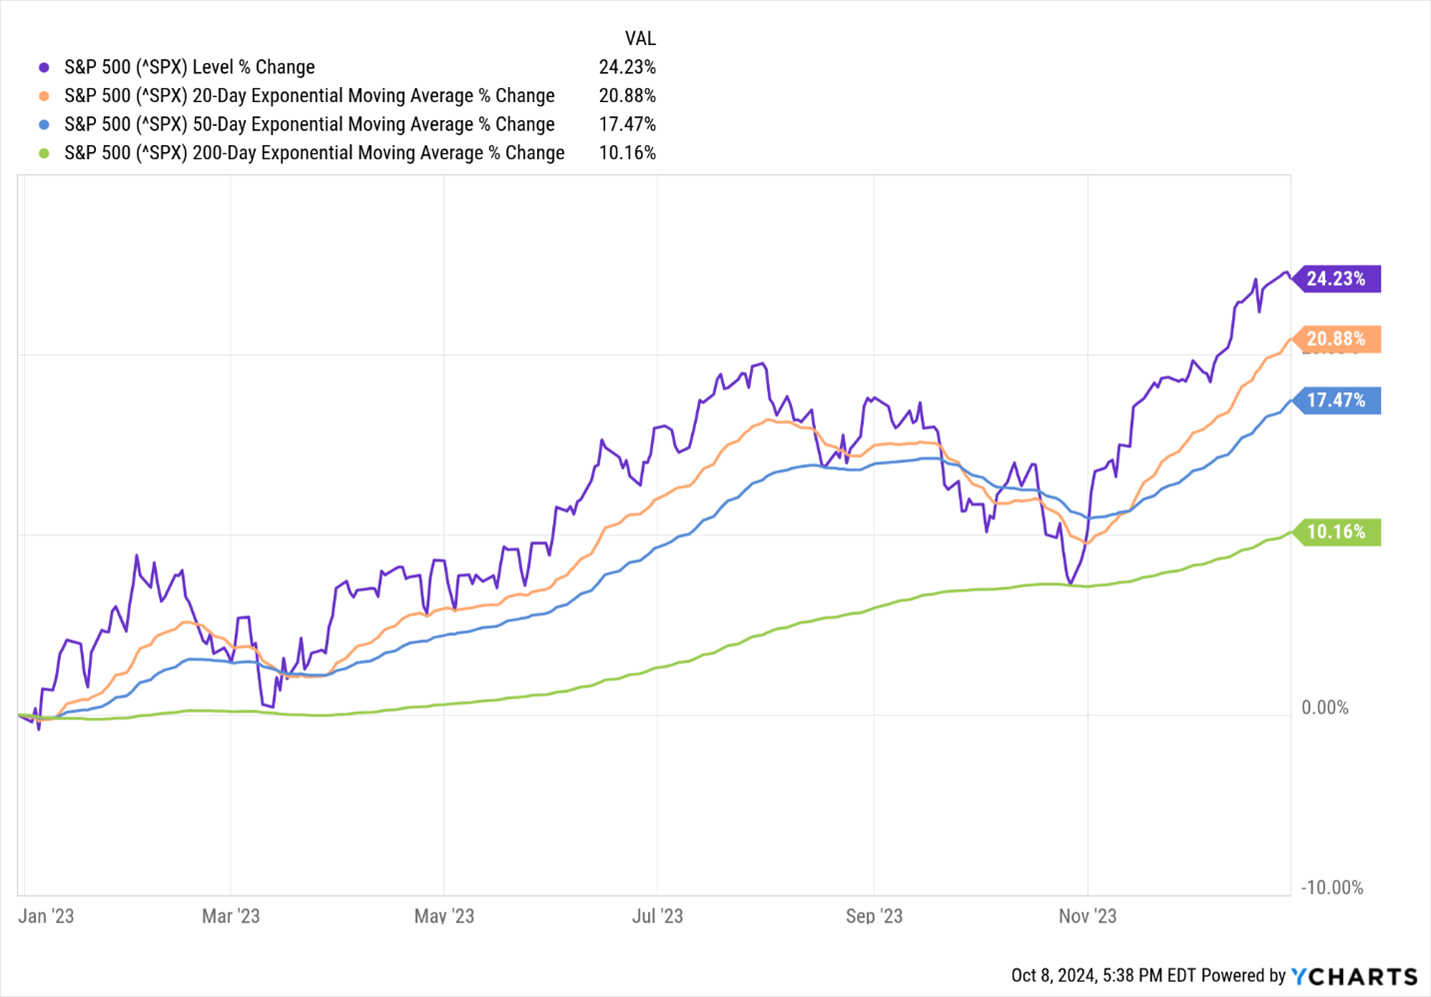
The Federal Reserve rate cut on September 18 was well received by institutional investors and has prompted renewed optimism for economic growth and avoidance of a recession (at least for now). The market recovery was momentarily interrupted by the short-lived dockworkers strike and today the S&P 500 closed at new all-time highs. Other factors that are encouraging investors are optimism for increasing 4th-quarter corporate profits, moderate gains year over year (YoY) in holiday sales, and nearing the end of the presidential election process.
The tech sector NASDAQ has a bit of a different narrative. The index has also recovered above its 20, 50, and 200 DMA and the DMA averages are stacking up in a positive trend.
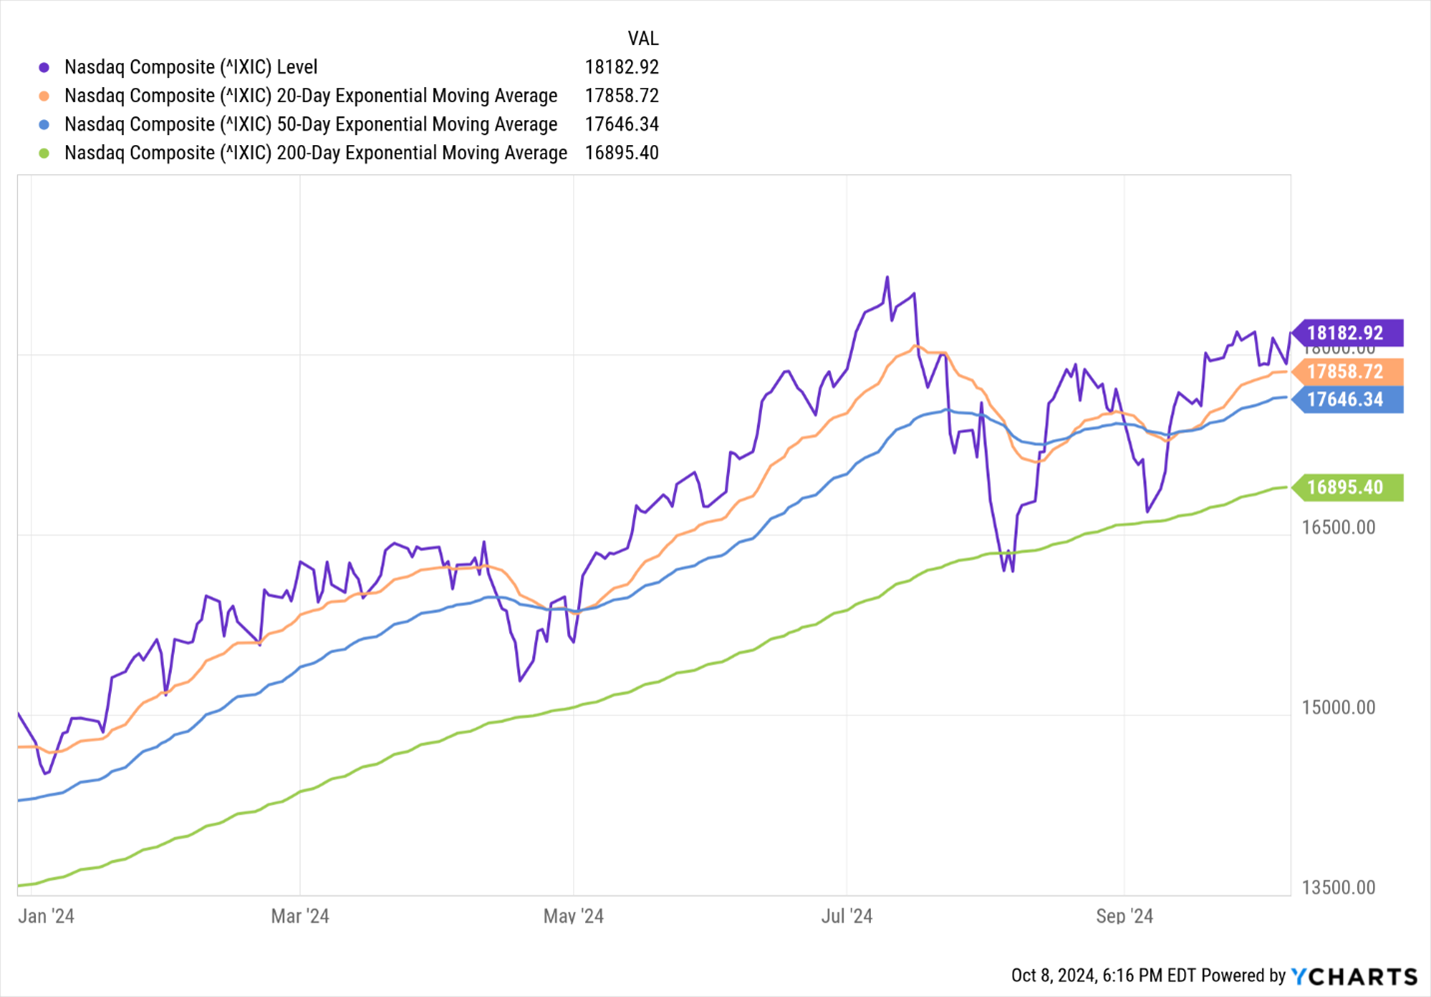
However, since the summer selloff bottoming out on August 7, the bounce-back recovery has been mild and has yet to rally to new highs. The index is still about 13% below its former peak reached on July 10. Nonetheless, the NASDAQ index is having another good year increasing 21.13% through today.
In 2023, the NASDAQ index performance was much stronger throughout the year. From the start, tech stocks rallied, finishing the first half with an outstanding 31.73% gain by June 30, 2023. The index gave up 35% of this gain by the time it bottomed out on October 27, and then rallied to close the year with an annual outstanding gain of 43.42%!
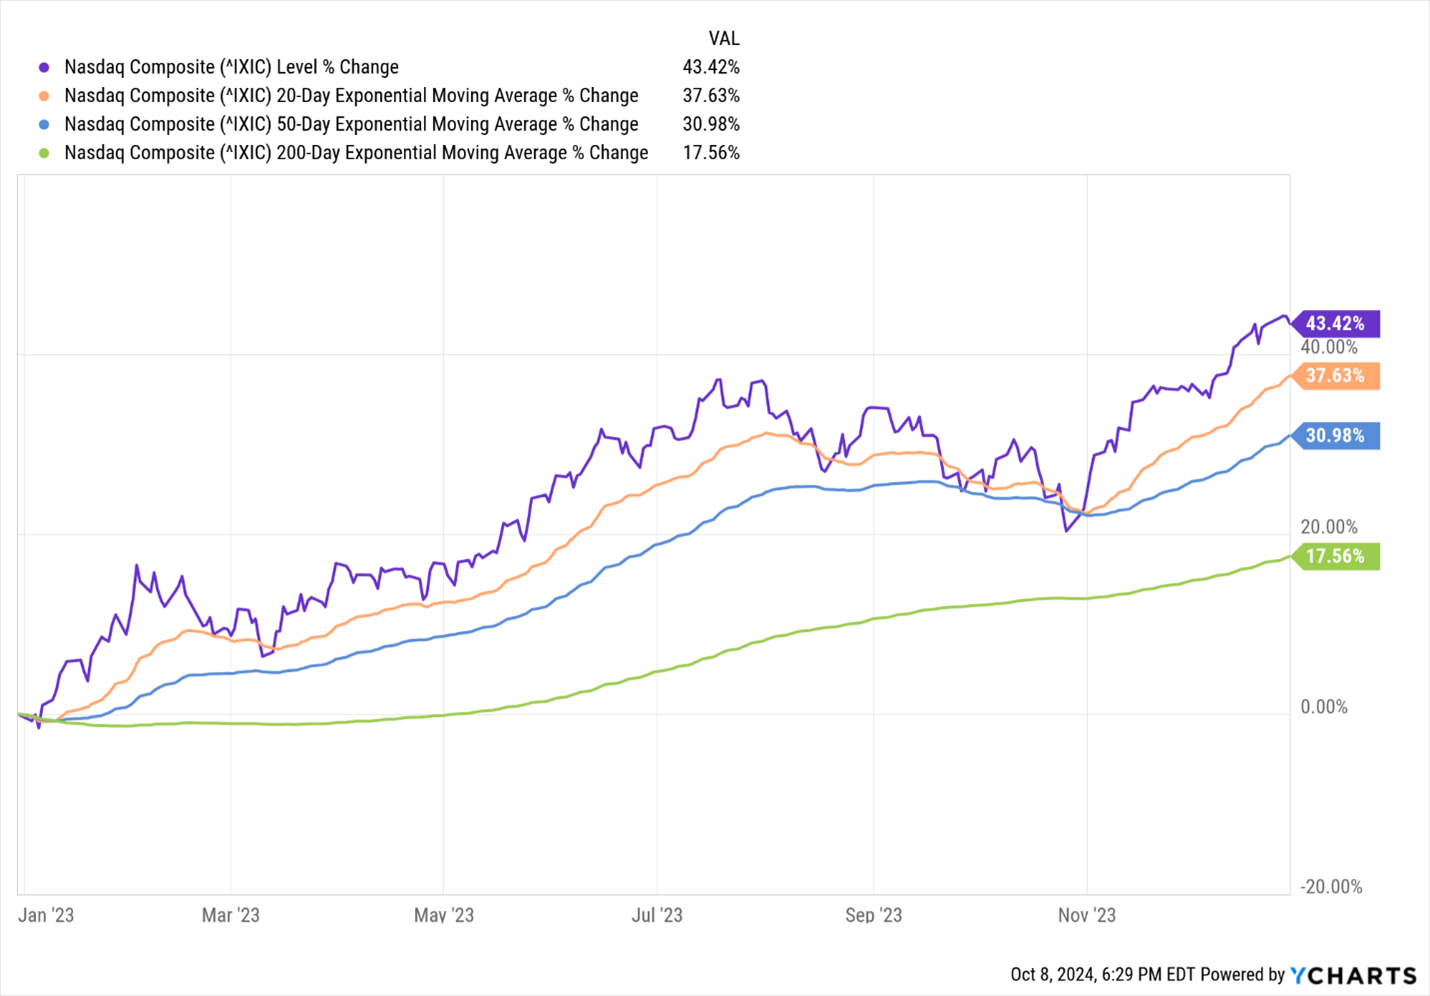
We would anticipate the NASDAQ and tech sector to continue its rally and close this year at new all-time highs.
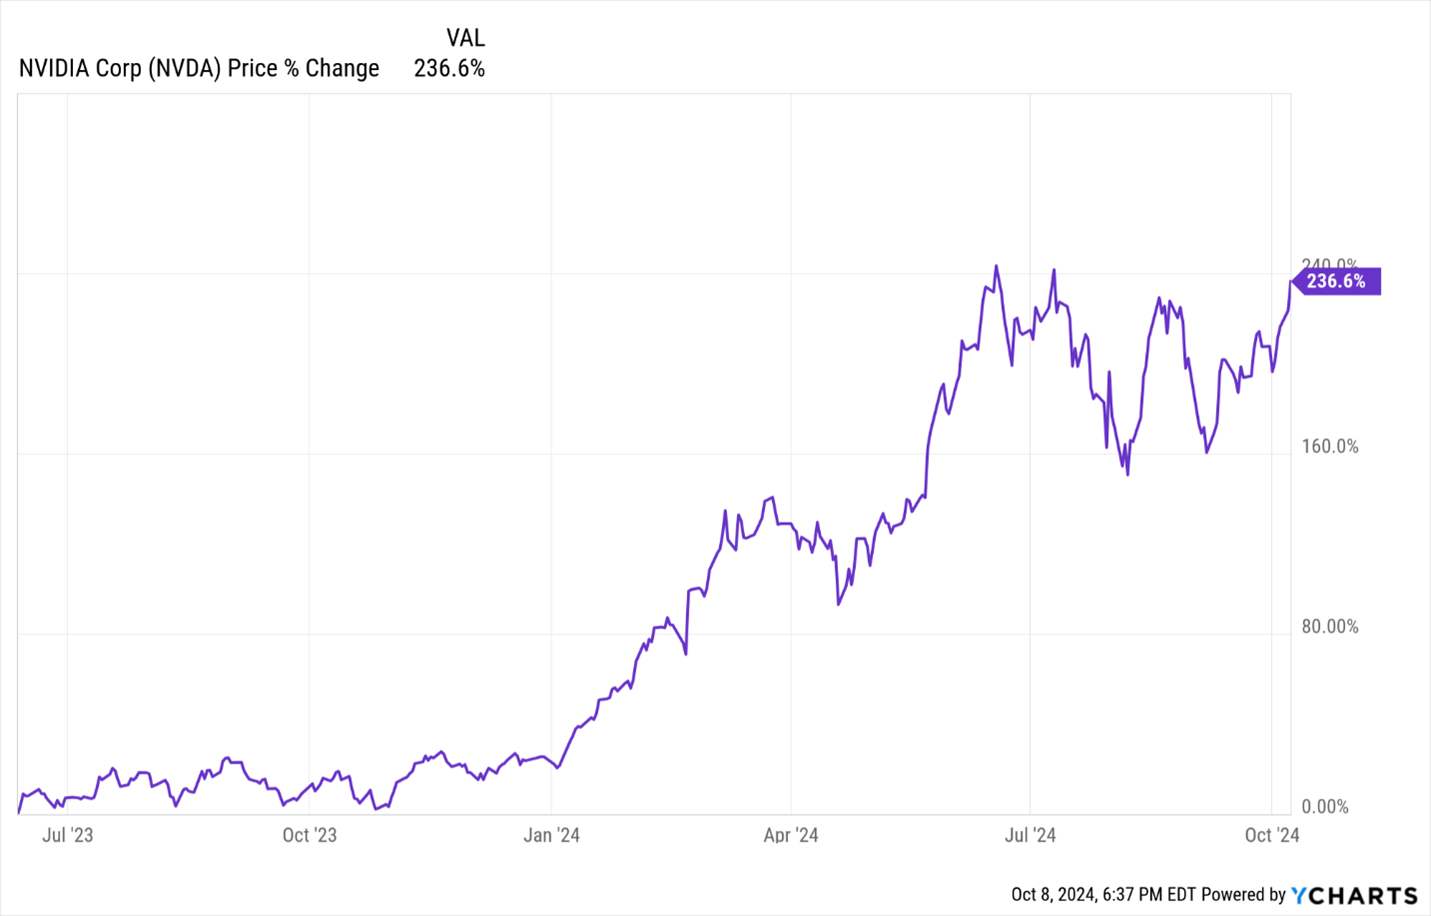
AI stocks including Nvidia (NVDA) were big drivers of the tech sector in 2023 that continued into 2024. We started adding NVDA to our model portfolios in June 2023 which has increased 236% through today.
What Does This Mean to Me?
The similarities between 2023 and 2024 are encouraging for the hope of a strong fourth-quarter rally. The dockworkers strike was a risk of sabotaging the rally but thankfully the two sides emerged with an agreement ending the strike. Unfortunately, the dock workers’ compromise will result in their suffering with only a 62% raise over the next six years.
The unknown factor is the future of consumer spending and holiday sales. Last week the non-farm payrolls increased by a surprised 254,000. More workers mean more paychecks for more spending. This is good news for the continued growth of the US economy since consumer spending represents 66% of this country’s Gross Domestic Product (GDP).
We maintain our favorable view of the US stock market and economy. Give us a call or send an email with your thoughts on this week’s UPdate. We also welcome the opportunity to assist you and your family with your investing and financial planning needs.

Anton Bayer
Back to Blog