

Small Business Owners Still Glum
Weekly BriefMay 15, 2024•5 min read
Today the National Federation of Independent Business (NFIB) released their April report of the small business optimism index. The index ticked up to 89.7 from 88.5 reading in March which was ahead of general Econoday forecaster consensus.
Small business owners have struggled significantly since the coronavirus outbreak, which has been reflected by the dramatic drop in the optimism index. The optimism index has been below the 50-year average of 98 for the past 28 consecutive months.
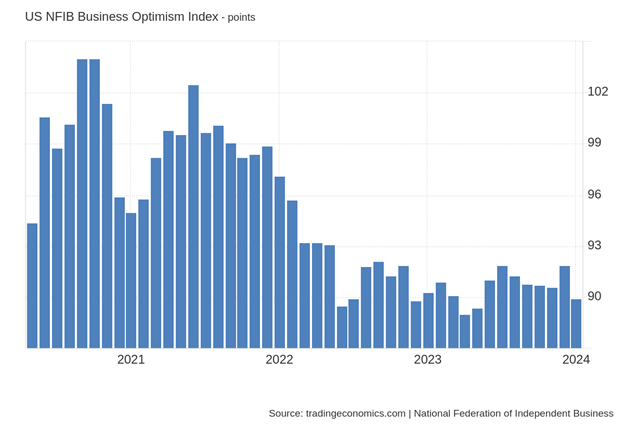
During challenging economic cycles, small business owners have fewer resources to grow and compete against mid and large-size companies. Inflation and costs remain the top concern for 22% of small business owners. Labor issues were the next set of challenges for small business owners. 40% reported they had job openings they could not fill, along with needing to raise salaries to retain current employees and attract new employees. A seasonally adjusted 12% of owners expect to create new jobs in the next 90 days, which is up 1% from last month.
At the same time, the number of business owners indicating potential price increases declined by 7% to 26%. One important aspect of the report is the number of small business owners expecting a rise in sales increased by 6%, although possibly at lower sale prices.
Based on this month’s report, it is evident that the challenges for small business owners have not changed much in three years. Despite the high visibility of the largest companies in America, small businesses, since the inception of this country, have been the foundation and critical driver of the US economy.
The Small Business Administration (SBA) estimates that businesses with less than 500 employees represent 99.9% of all businesses in America, which is a total of more than 33.3 million companies. Nearly 50% of the working population work for a small business, a remarkable number considering that 80% of the small businesses have no staff. Specifically, 16% of small businesses, which equates to 5.4 million companies, have between 1 – 19 employees. Doing the math, 31,968,000 small companies are responsible for hiring almost half of the working population in America.
The S&P 600 Small Cap index has reflected the challenges small businesses have faced since the pandemic in terms of lagging performance to the mid and large-cap indices. For the past three years, profits have soared for large companies, specifically those with new technology, while the small companies have struggled to be profitable. The chart below illustrates since May 1, 2021, the consistent underperformance of the S&P 600 Index (purple line) with a cumulative return of -0.47% compared to the S&P 500 increasing 24.89% (orange line) and NASDAQ 17.51% (green line). The S&P 400 (mid-cap) performance came in somewhat in the middle of the pack with a 10.62% cumulative return (blue line).
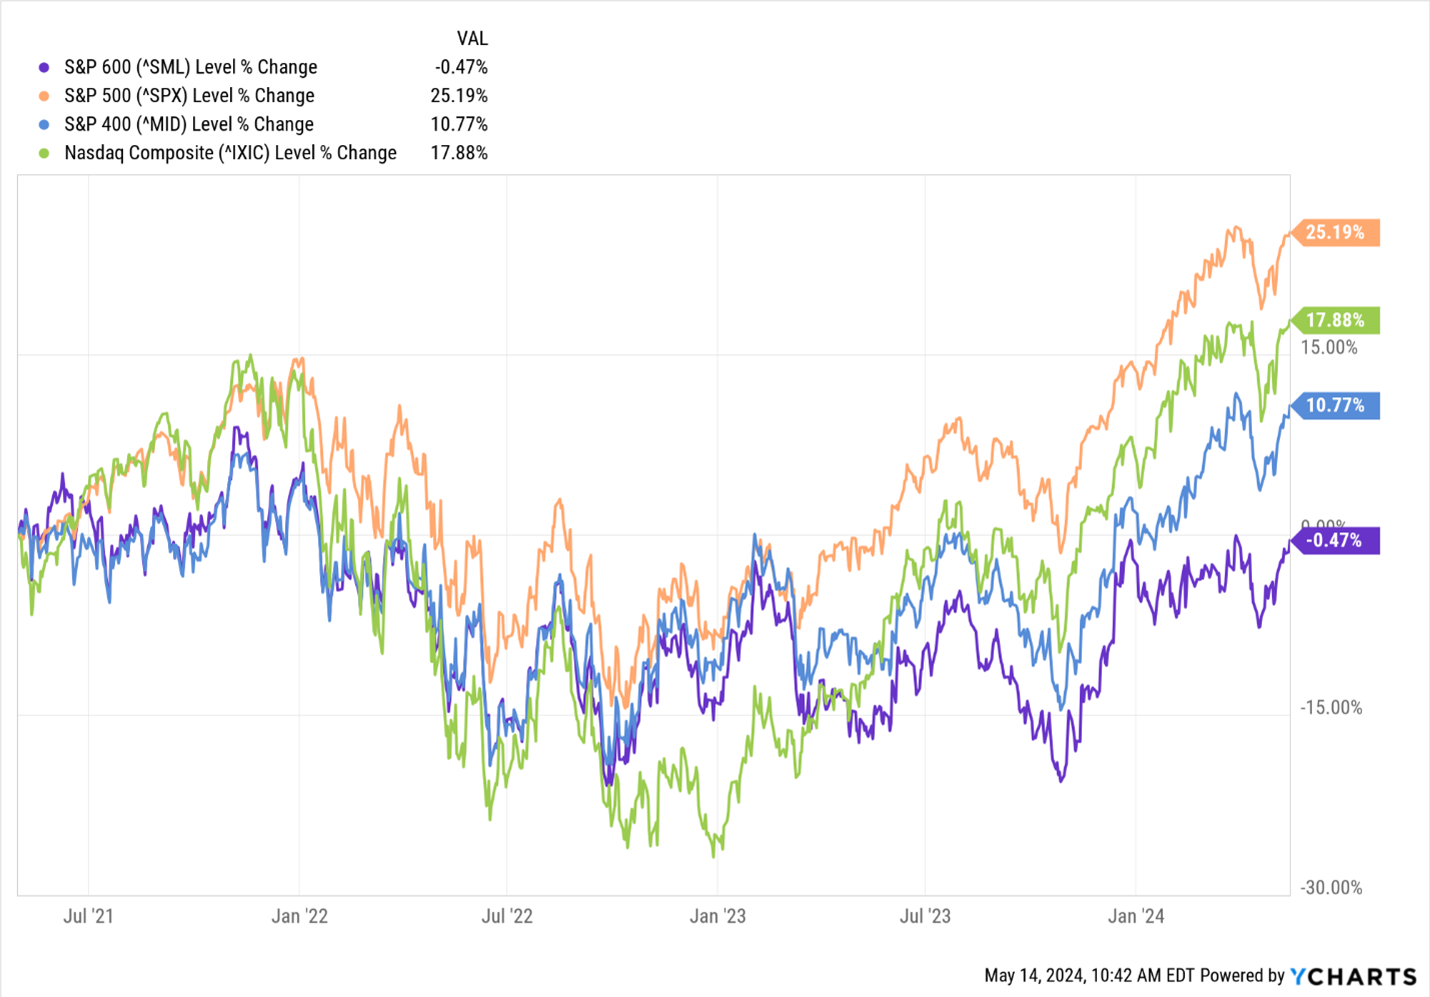
We have been referencing the underperformance of the small cap sector for years. We have underweighted the S&P 600 index since 2020 and late last year completely removed it from all our model portfolios. We allocated the proceeds from S&P 600 to NASDAQ and large cap while keeping a small percentage to the S&P 400.
We monitor these four indices as they will provide insight into the next buying opportunities. While larger companies and technology currently dominate the headlines, the upside potential of the S&P 600 continues to increase the longer this index lags behind.
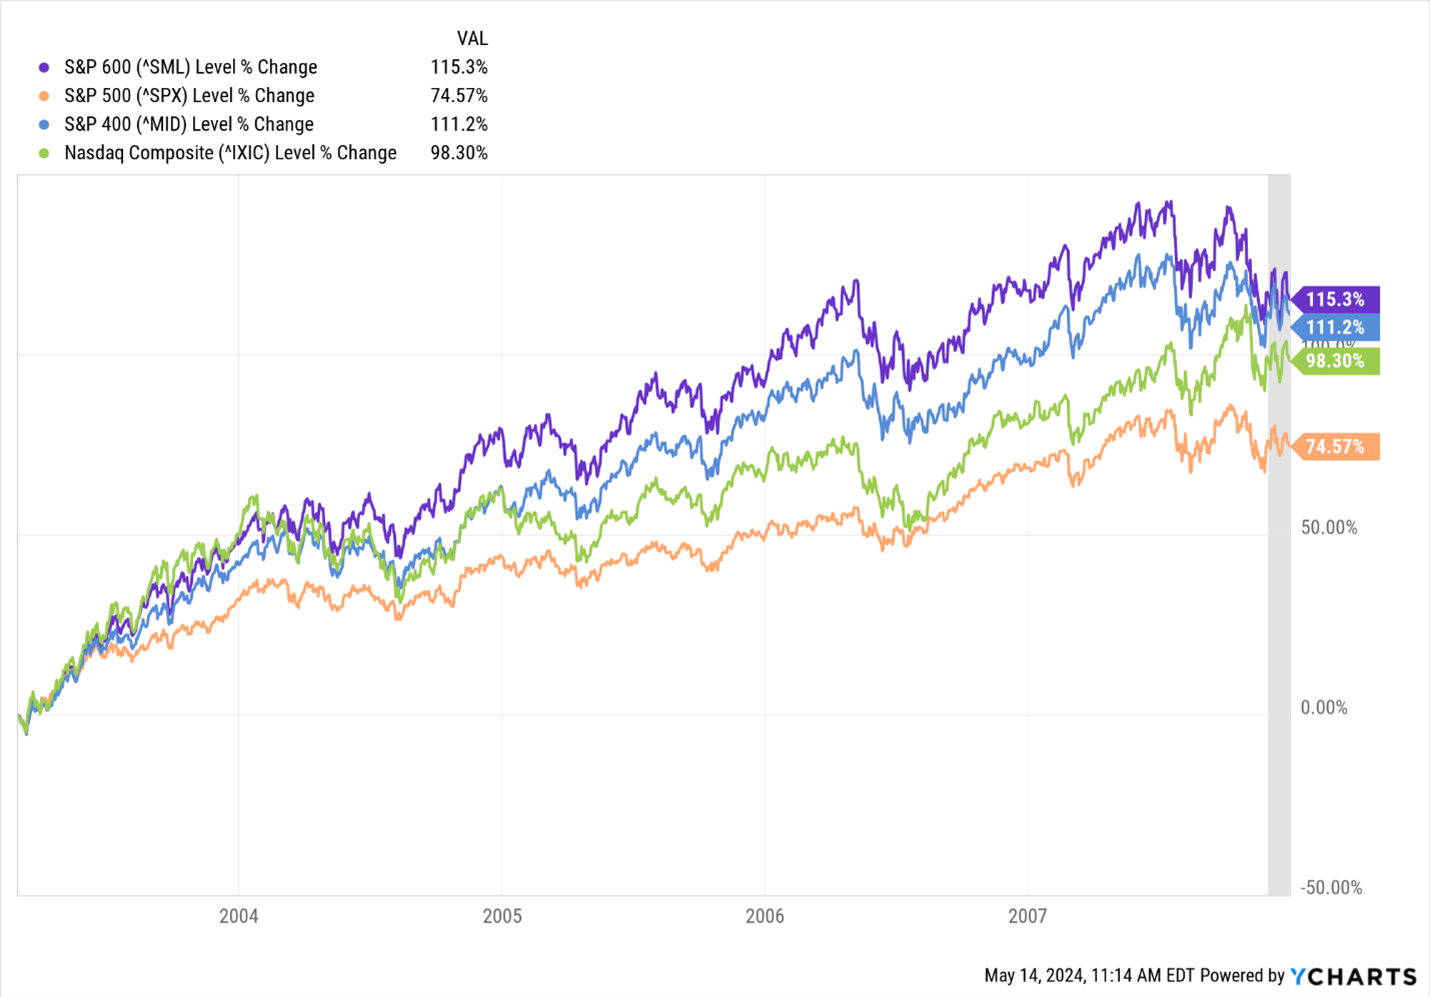
Referring to March 2003, when the stock market finally bottomed out after three years of significant declines in all four indices during the Dot.com bust, it was the S&P 600 and S&P 400 that led the group for the next five years up to the 2008 Great Recession. During this period, the S&P 600 increased 115.3%, and the S&P 400 closed behind, rising 111.2%. Meanwhile, NASDAQ increased 98.3%, and the S&P 500 trailed with only a 74.57% total return. The S&P 500 would have provided nearly a 26% lesser return to investors compared to the small and mid-cap sectors.
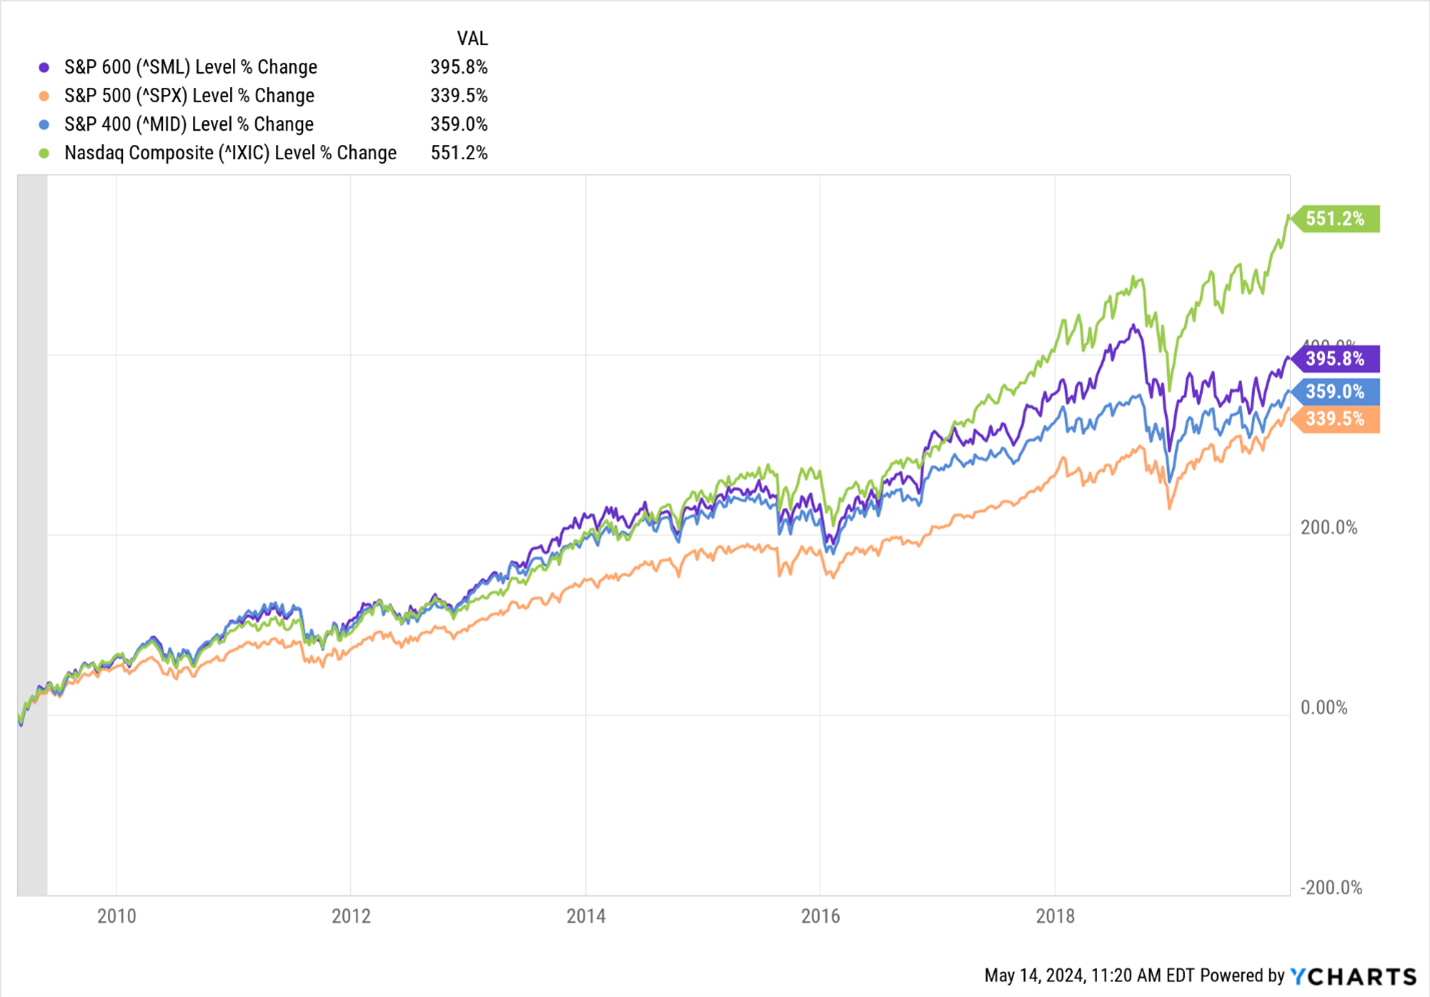
Following the 2008 Great Recession, the stock market finally bottomed out in March 2010 (another March bottom). Again, the S&P 600 and S&P 400 were the leaders of this rally for the next four years until 2014, when investors began focusing on NASDAQ. Even though the NASDAQ index significantly outperformed the other three indices from 2014 through 2019, the small-cap index provided the second-best returns for this period, and the S&P 500 again trailed all four indices in performance.
What Does This Mean to Me?
While the largest companies in America currently dominate the headlines, it is the small businesses that employ nearly 50% of the labor force and typically are the first to recover after recessions. This time around, after the pandemic, small businesses did not lead larger companies as small business owners struggled with rising costs, increasing their staff, supply chain restrictions, and competitive pricing. The trillions in government stimulus have evidently negatively impacted small businesses, while millions of people received generous unemployment benefits, and larger companies received billions through the PPP (Payroll Protection Program).
Regardless of the reasons, sector leadership changes. For the past three years, the S&P 500 and NASDAQ have been the leaders over mid and small cap indices. But be sure to know this leader board will change. During the past two growth cycles of 2003 to 2007 and 2010 to 2019, the S&P 500 significantly underperformed the small and mid-cap indices.
Let us know what you think of this Weekly Brief. As we approach the middle of the year and many graduations, this is a good time for us to connect and discuss your financial goals and how we can help. We welcome the opportunity to assist you in achieving financial success and independence.

Anton Bayer
Back to Blog