

Rebound in Retail Sales
Weekly BriefApril 17, 2024•5 min read
As we have discussed in past Weekly Briefs, the core of the U.S. economy is consumer spending, which represents 66% of the US Gross Domestic Product (GDP). This is significant as the GDP is the basis of defining the general health of all economies, although each country has different definitions of this economic indicator. Investopedia defines GDP as the “total monetary or market value of all the finished goods and services produced within a country’s borders in a specific time period. As a broad measure of overall domestic production, it functions as a comprehensive scorecard of a given country’s economic health”.
Based on this definition, retail spending by you and I, along with everyone else, represents the majority of the U.S. economy. Therefore, to understand the financial health of the U.S., we need to look no further than the financial health of households and consumers. The U.S. economy can be narrowed down to the following equation:
People working = people spending = economic activity
Adding either the word “More” or “Less” in the equation will provide insight into the future of the economy. More people working will result in more spending and more economic activity. Conversely, less people working is less of everything else. Currently, more eligible people are working in the history of the U.S., with an average of 250,000 more people being added to payrolls every month for the past 15 months. Unemployment is at the lowest level in 50 years. More importantly, the number of non-farm payrolls continues to increase as more employers are hiring each month, as noted in our April 9 issue titled, “More Good News… Darn”. Pay scales have been increasing at or above the inflation rate as defined by the Consumer Price Index (CPI), with many entry-level jobs starting at $15 to $20 per hour.
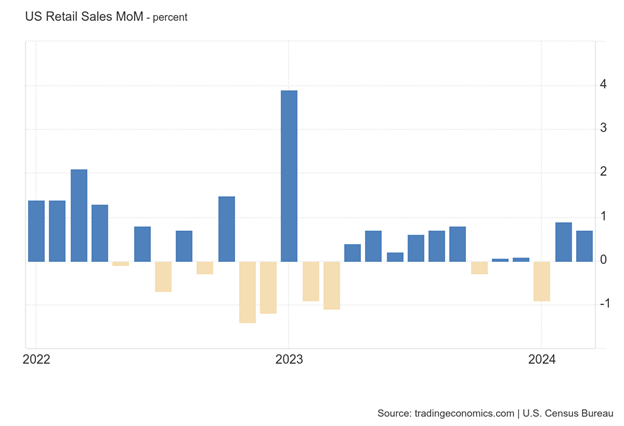
Yesterday the Bureau of the Census, U.S. Department of Commerce released the month over month (MoM) change in U.S. Retail Sales. March had a larger than expected 0.9% increase over February volume and reached an all-time high in sales of $704.5 billion in transactions which just nudged past the previous all-time high reached in December 2023.
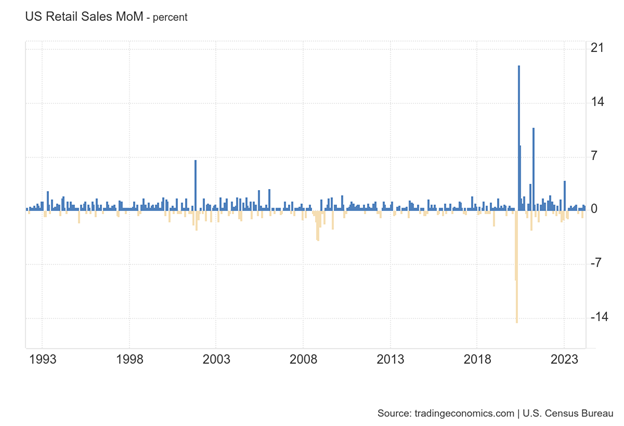
Note that the chart below illustrates the MoM changes in Retail Sales and not the dollar amount of retail sales.
Looking at the chart below of MoM changes in retail sales going back to 1992; you will notice far more blue bars indicating increased monthly sales than yellow bars indicating fewer monthly sales from the previous month.
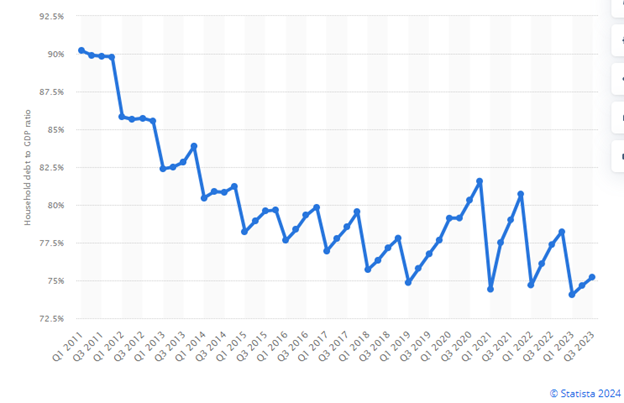
In regard to the actual dollar amount of retail sales, for the month of December 2019, at the height of economic activity and strong bull market, total retail sales were $525.4 billion. For the month of February 2024, total retail sales were $704.5 billion. The annual compounded increase in retail sales from December 2019 through February 2024 is 7.4%. In other words, consumers have been increasing their spending by 7.4% a year for the past five years, which appears to be primarily from savings and earnings vs debt.
I make this assumption based on the declining level of consumer debt during the same period. The chart below by Statista on consumer debt vs GDP illustrates the decline in the ratio of consumer debt to the US GDP.
What Does This Mean to Me?
The U.S. economy is very complex with many factors that will result in either a growing or contracting financial environment. However, 66% or more of U.S. economic activity is directly related to consumer spending. Therefore, the future trends of the economy and stock market may be identified by monitoring consumers and households. Retail sales are the trailing indicator for the health of consumers. Leading indicators for early signs on the future trend of consumer spending may be determined by monitoring reports on their sentiment and confidence reported by the University of Michigan. Also, the business leader’s sentiment will be monitored as they evaluate hiring or reducing their workforce along with changes in payroll that will impact consumer finances. At this juncture, we maintain a favorable view of the U.S. economy and stock market.
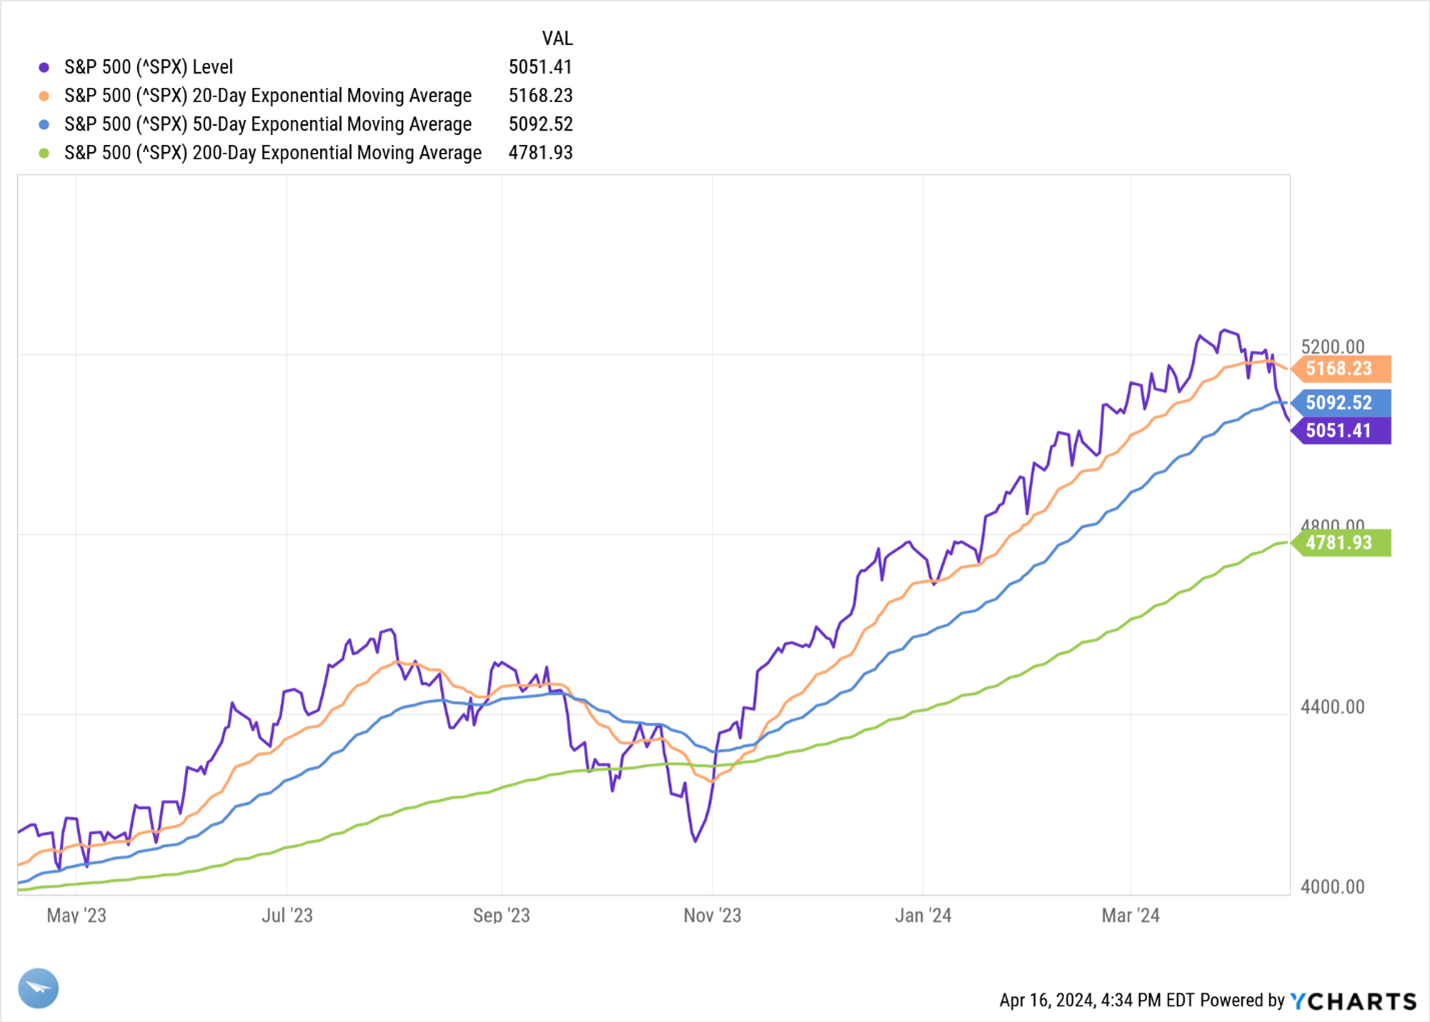
However, for the near term we have been indicating the possibility of a soft stock market in the next number of months after a strong first quarter rally. Since March 28 the S&P 500 has declined 4.91% and dropped below its 20 and 50 Day Moving Average (DMA).
The primary driver for the recent selloff has been attributed to frustrated institutional analysts and investors looking for lower interest rates. Based on today’s meeting in Washington DC with Jerome Powell and Tiff Macklem, Bank of Canada Governor, neither central banker sees inflation at an acceptable level and no indication they are prepared to lower interest rates. Ironically, the scenario for the central bankers to lower interest rates is for their respective economies to begin to contract. Contracting economies can lead to recessions that result in declining corporate profits and rising unemployment.
Apparently, Wall Street is fine with this scenario so long as they get lower interest rates and cheaper debt. I agree with Jerome Powell’s comments today that holding interest rates and letting the slow decline in inflation continue is a better path than injecting new variables in the credit markets that may or may not help their cause.
Let us know your thoughts on this Weekly Brief. We welcome the chance to hear from you. More importantly, let us know how we can help you and your family achieve your goals this year.

Anton Bayer
Back to Blog