Today, the University of Michigan Consumer Sentiment Index was released for February. We monitor this economic indicator on consumers and their views of the economy as it provides us with potential insight into the future of consumer spending. What consumers do with their money represents 66% of the nation’s financial activity, as referenced by the Gross Domestic Product (GDP).
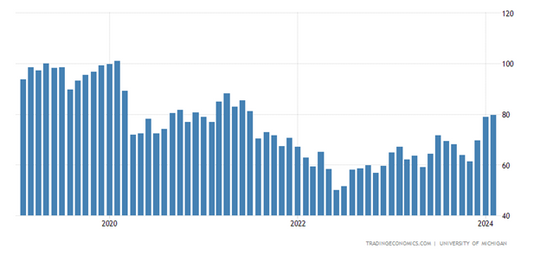
The February sentiment index reached a new high since July 2021, increasing to 79.6 in February 2024 and 79.0 in January. Analysts were even more bullish, expecting consumer sentiment to reach a reading of 80.0.
Trading Economics opined on the University of Michigan report stating that the consumer expectations index also improved to 78.4 vs. 77.1 while the current economic conditions gauge edged down to 81.5 vs. 81.9. Meanwhile, consumer inflation expectations for the coming year ahead increased slightly to 3% from 2.9% while the five-year outlook was at 2.9%.
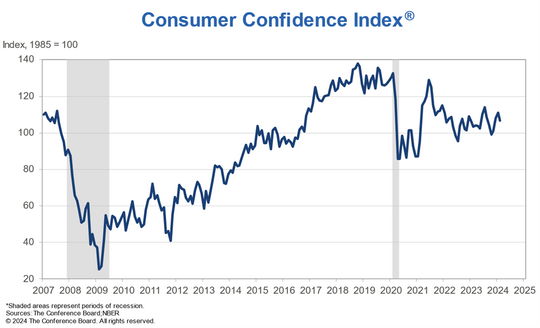
Conversely, The Consumer Confidence Index, as reported by The Conference Board, indicated that confidence declined slightly in February, breaking a three-month rising trend. A key to consumer confidence is largely due to their views on inflation, which has slowed significantly since 2022, and confidence has been helped by a strong labor market.
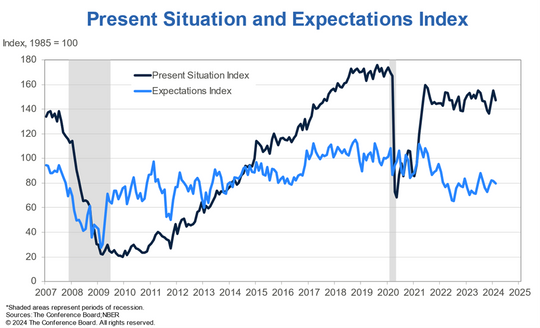
Also, in contrast to the University of Michigan report, the Conference Board report indicated that consumers’ expectations are declining compared to the present situation. In the report, 41.3% of consumers said jobs were “plentiful,” down from 42.7% in January.
Consumer’s moderate view of the US economy is at odds with the views promoted by the main media. Daily, I have calls from clients who express a lot of concern about the economy and risks in the stock market. Comments that have been repeated more lately are that this stock market seems reminiscent of the crazy 1990s dot.com tech market.
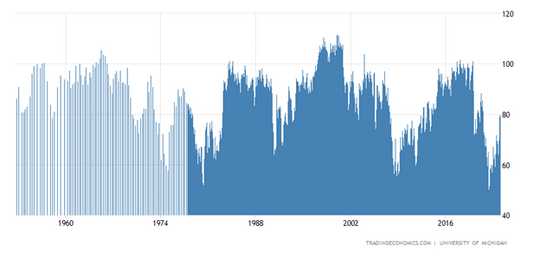
My response is that neither the stock market nor the economy is anywhere near the lofty levels of economic growth and stock valuations reached in the 1990s. The first evidence is consumers sentiment is well below the levels of prior periods. Below is a chart of Consumer Sentiment from 1950. Although consumer sentiment has been improving since the middle of 2022, we are not close to the levels of the late 1990’s.
As a reminder, the 1990s era experienced stocks of dot.com companies exploding in stock prices, increasing some days by 100%, many with no history of ever being profitable. Alan Greenspan, former Federal Reserve Chairman, made the reference in his televised speech on December 5, 1995, that market conditions may be reaching levels of “Irrational Exuberance.” This was five years before the stock market actually began a massive selloff in March 2000 that lasted three years.
The next significant high reached by consumer sentiment readings was the four years prior to the 2020 pandemic. Again, as indicated on the chart, consumer sentiment has been improving over the past year but is still well below the levels reached in 2019.
WHAT DOES IT MEAN TO ME?
We maintain a favorable view of the US economy and stock market. It is comforting when recent highs of economic indicators are still well below former levels. This would mean more room to improve and grow. However, when it comes to the stock market and, specifically, the S&P 500 index, new highs are positive indicators of future growth. Obviously, as companies continue to earn more profits, their respective stock prices will continue to rise with increasing company valuations.
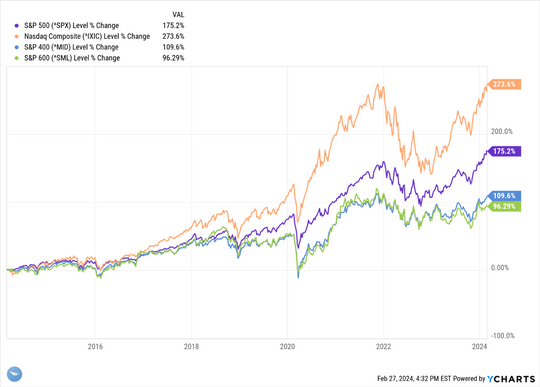
The four major indices have all rallied to their new highs this year. Below is a chart of the four indices for the past ten years. Note that S&P 500 and NASDAQ have fully recovered from the 2020 and 2022 selloff. However, both the S&P 400 (mid-cap) and S&P 600 (small-cap) indices did not experience as much volatility these past three years but have not rallied with their peers in 2023. We are removing the S&P 600 from our portfolios until this index begins to have positive technical indications of growth.
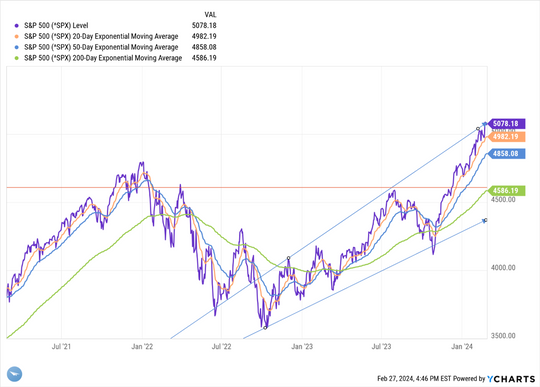
Since the S&P 500 bottomed out on October 25, 2023, it has rallied to new all-time highs. The trend for the S&P 500 since late 2022 has been positive, with all sell-offs stopping above previous lows and subsequent rallies taking the index to new highs. The blue lines indicate the upward trend of both the lows and highs since late October 2022.
The red line is a potential support level should the index begin to decline. The support level is at 4586, or about 10% below today’s close.
Give us a call or send an email with your thoughts on this Weekly Brief. More importantly, let us have the opportunity to assist you and your family with your financial planning and pursuing your financial and personal goals.
Anton Bayer
Back to Blog
Share this post on social, email, or by word of mouth (there’s no button for that last option).