

Consumers Earning and Spending More
Weekly BriefMay 01, 2024•4 min read
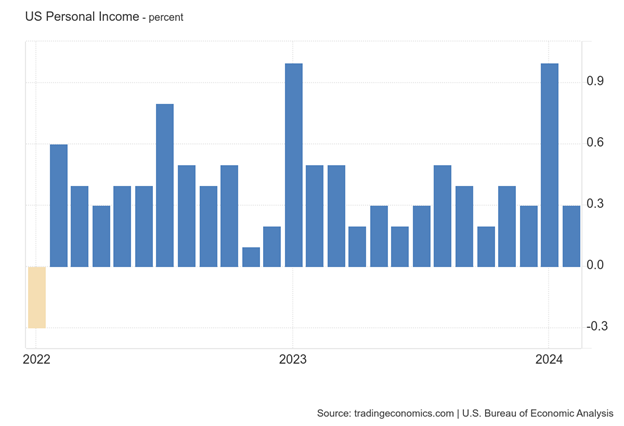
Yesterday the Bureau of Economic Analysis released its monthly report on consumer income and spending. The report indicated that personal income rose 0.3% and has increased each month now for 24 consecutive months which is good news for households and the economy.
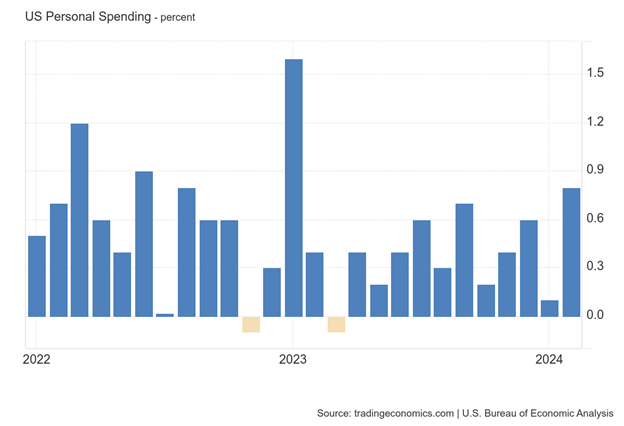
As expected, as personal income increases, so will personal spending. The Bureau tracks what they call Personal Consumption Expenditures (PCE) to monitor household spending. For the same period as referenced above, PCE has increased each month since January 2022 except for months November 2022 and March 2023.
Consumer spending, which represents 66% of the US economic activity, is key to the US economy and its ability to continue to grow. With more people working in the history of the US, it is important that their earnings are increasing, at least at inflationary rates. Discretional savings are possible as wage growth exceeds inflation and consumers have a budget surplus to either pay down debt, spend more, or invest.
Personal income has steadily increased each month for decades and for many of the years at a pace greater than inflation. Looking at the chart below of Personal Income since April 1959, when the Bureau started tracking this information, blue lines indicating a monthly increase significantly outpaces the few yellow lines of declines.
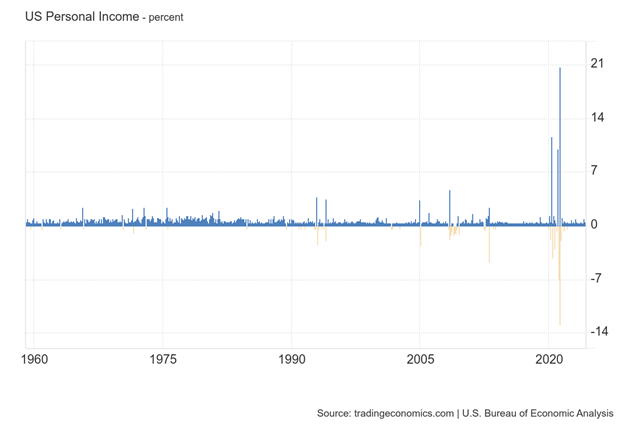
Even when there were 2%+ declines in monthly income, within a very short period of time, there was a strong 2%+ bounce back of monthly income gains.
The Great Recession (2007 – 2009) was a devastating time for most Americans. Many lost their jobs and houses during this period. Wages declined almost every month from June 2008 to July 2009. When wages started to increase, the monthly increases were much less, with no former big monthly gains for years to follow as experienced before the Great Recession.
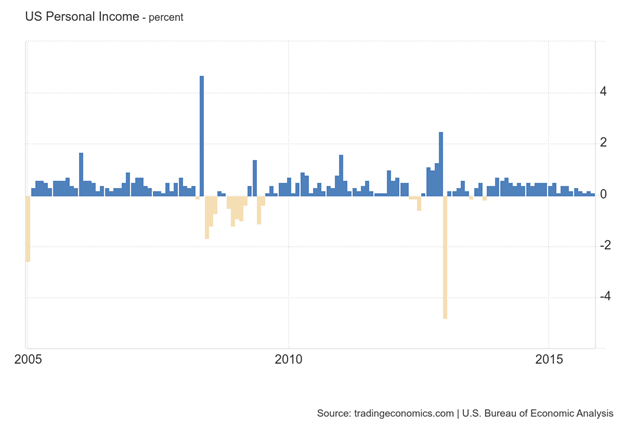
January 2013 was the single largest monthly decline in personal income since 1959. Personal income plummeted 4.9% in January from the month prior. What happened in January to shock Americans with lower income?
Very simply taxes.
Unbeknownst to most Americans, on December 31, 2012, while many were making New Year resolutions to earn and do more in the new year, they would have to do it with a smaller paycheck. Effective January 30, 2013, their net paycheck was going to be less due to the expiration of the Payroll Tax Holiday. Years earlier, Congress passed the Unemployment Insurance Reauthorization and Job Creation Act of 2010. This Act was a short-term sweeping tax reduction to help Americans through a recession that included lowering personal income tax rates, reducing payroll withholding for Social Security, reducing Alternative Minimum Tax schedules, and extending the Childcare Tax Credits.
Like Cinderella’s outfit, the Act disappeared on January 31, 2013. Overnight employee net paychecks were reduced with the addition of formerly waived tax withholdings. Prior to January 2013, employees enjoyed large monthly increases in their paychecks as less taxes were being withheld. From the date of the Act’s passage, payroll monthly gains were consistently 0.5% to 1.0%, with personal income surging 5.9% from October 2012 to December 2012 as employers passed on the tax savings to their employees.
That all ended in January 2013, when the Act expired. After January 2013, monthly gains in payroll were significantly less, and no monthly gain was greater than 0.50% other than January 2014, March 2014, and January 2017.

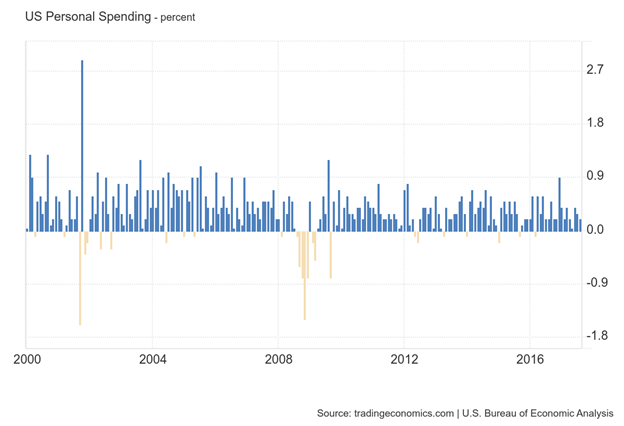
Personal spending monthly increases never recovered to the levels prior to the 2008 Great Recession. Monthly gains in spending after January 2013 did grow slowly but experienced five months of declines in the next three years that had not happened since the 2000 – 2003 Dot.com bust.
What Does This Mean to Me?
The lesson learned is the biggest impact on consumer spending is economic recessions or taxes. For 2024, neither a recession nor tax law changes seem to be a near-term probability. The economy remains stable with solid employment participation as more people are employed in the history of the US. With 2024 an election year, politicians are not likely to campaign (and win) on a platform of raising taxes. The stock market likes it when Washington is distracted and not focusing on the economy or our money.
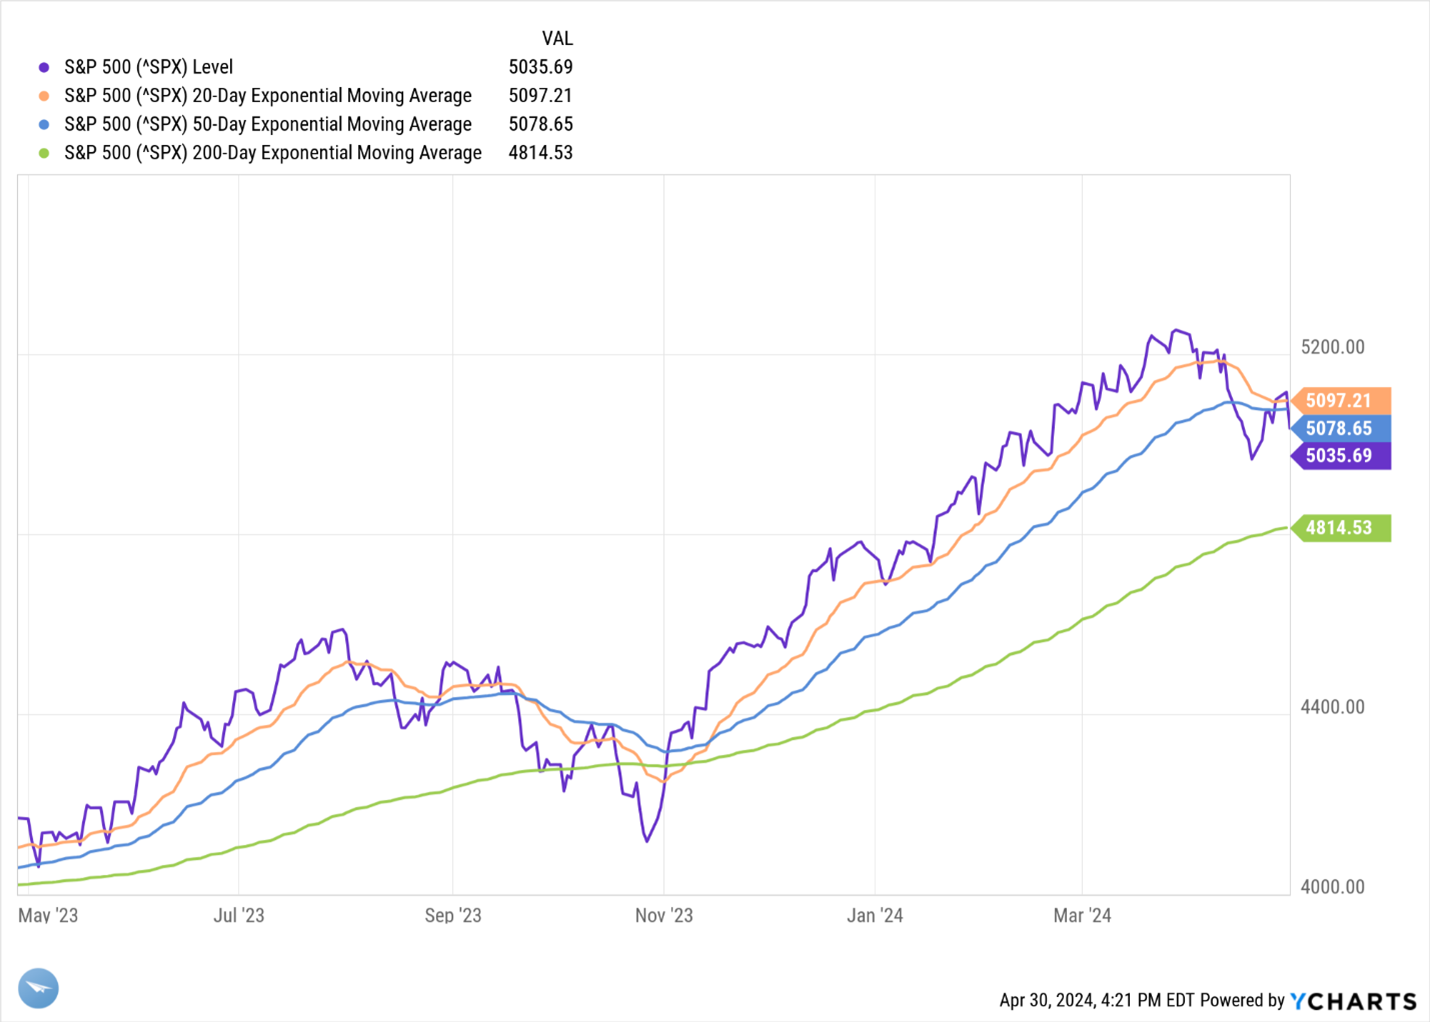
We maintain a favorable rating in the US economy and stock market. The S&P 500 experienced a strong rally in the first quarter and, as we had suggested, peaked on March 28 for the year-to-date (YTD) gain of 10.16%. Investors began taking profits in April, and by April 19, the S&P 500 YTD declined to a YTD gain of 4.14%. Since then, the index has slowly recovered some of the decline. Currently, the index is slightly below its 20 and 50-Day Moving Average (DMA) and well above its 200 DMA.
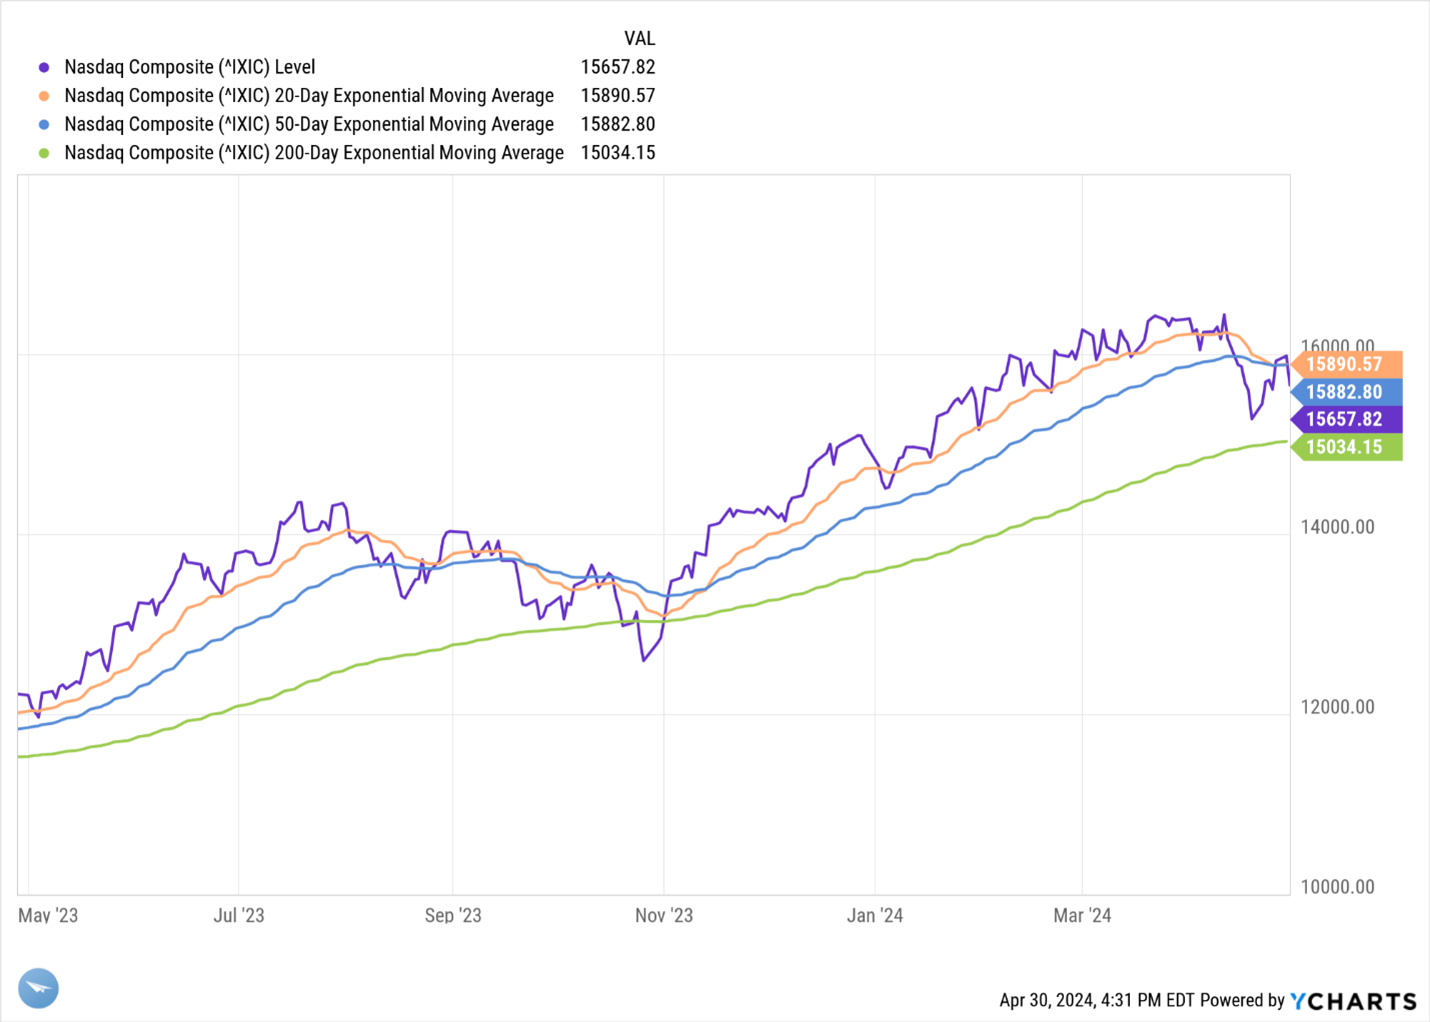
The NASDAQ index peaked for the year on April 11, having gained 9.53%. Similar to the S&P 500, investors also sold technology stocks at the end of March to bring the index down to a yearly gain of 1.8% by April 19. Since then, the index has rallied and is currently up 4.31% for the year. NASDAQ is also slightly below its 20 and 50 DMA and well above its 200 DMA.
Let us know your thoughts on this Weekly Brief. Also, we welcome the opportunity to assist you with your financial planning in achieving your financial goals. Give us a call your send us and email to schedule a time to connect.

Anton Bayer
Back to Blog