

Are Interest Rates the Only Issue for Housing?
Weekly BriefJuly 02, 2025•5 min read
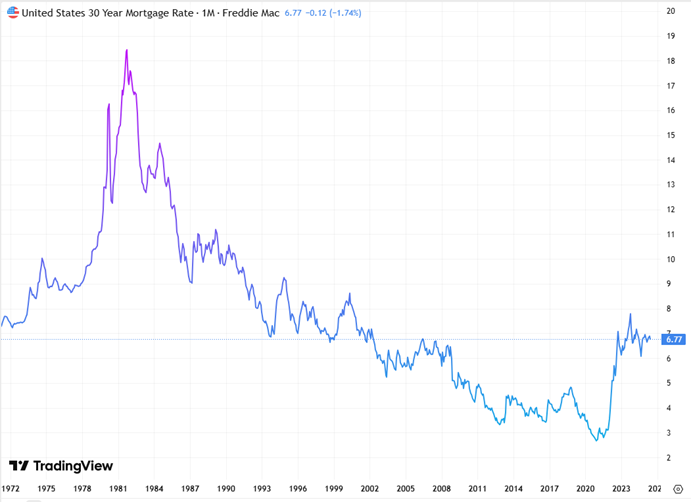
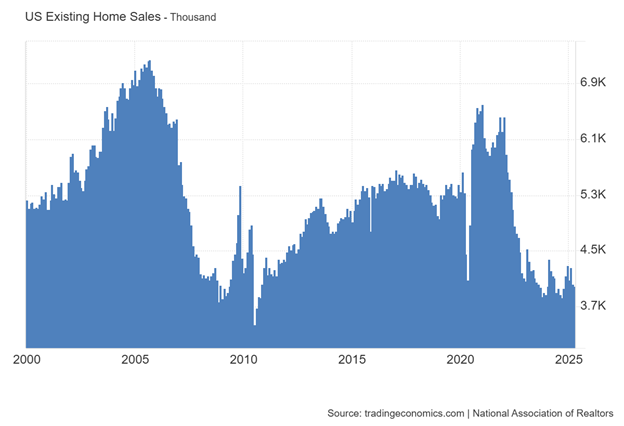
If you have been trying to sell your home or residential rental property, you are very aware of the small smattering of buyers. This past April had the fewest homes sold in April since 2008. Persistent high mortgage interest rates have nearly doubled the cost of owning the same home compared to the fixed rates offered prior to 2022. Unfortunately, the era of 2% to 3.5% fixed-rate mortgages is not the norm but an anomaly. In no time since 1972 have fixed mortgage interest rates been as low as the historic record rate of 1.92% reached on December 20, 2021. The mean average of fixed mortgages since 1972 is 6.77% with the highest rate, 18.41%, reached on September 1, 1981.
Last week, the National Association of Realtors (NAR) released its report on total existing national home sales in May. Surprisingly, May experienced a 0.8% increase in seasonally adjusted annualized sales to 4.03 million. Sales were higher in the Northeast (4.2%), Midwest (2.1%), and South (1.7%), offsetting the drop in the West (-5.4%). Meanwhile, the median sales price for existing homes was $422,800.
According to NAR Chief Economist Lawrence Yun,
-
“The relatively subdued sales are largely due to persistently high mortgage rates. Lower interest rates will attract more buyers and sellers to the housing market. Increasing participation in the housing market will increase the mobility of the workforce and drive economic growth.” Source: National Association of Realtors.
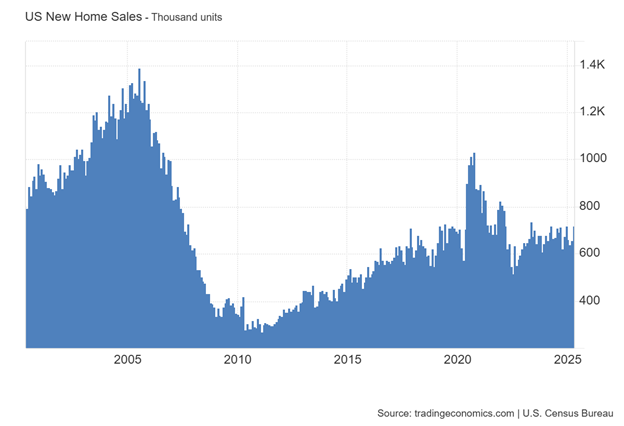
The sales of new homes plummeted in May by 13.7% from the seasonally adjusted rate of 623,000 units. The decline in May sales erased the 9.6% increase in April sales. May was the sharpest decline in sales since June 2022, when the Federal Reserve began its rate hike campaign to slow inflation.
New home sales sank in the South (-21% to 349,000), the West (-5.4% to 159,000), and the Midwest (-7.1% to 78,000). The median home price rose by 1.4% to 507,000, representing 9.8 months of supply at the latest sales pace. Source: U.S. Census Bureau
A main issue for the housing market is whether Americans can afford to buy an existing or new home. NAR created in 1981 an index titled the “Housing Affordability Index”. This index calculates the national average income to buy a national average house price based on a 20% down payment at the current mortgage rate. An index of 100 indicates that American households with a national average income had 100% of the income required to purchase a home based on the national average price. An index below 100 (e.g., 94) represents that the national average of income is only 94% of the required income to buy a home at the national average price.
Below is a historical chart of the Affordability Index starting in 1981. When NAR started tracking housing affordability, the index was below 75, which indicated that the national average income was only 75% of the required income to buy a home. By the mid-1980s, the index rose above 100 due to rising average income and declining fixed mortgage rates. During the 1990s, incomes in the tech sector soared, rallying the rest of the economy, and the Affordability Index remained above 125 up through 2004 before dropping to 100 in 2006. As housing prices crashed during and after the 2008 Great Recession, the Affordability Index soared to its record high of 208.1 reached in February 2013. The index at 208.1 represents that the national average income was now 208.1% above what was required to buy an average-priced home. For nearly 14 years, the Affordability Index was around 150 up to August 2021. Then, in 2022, the Federal Reserve began its rate hike campaign to slow inflation. Fixed mortgage rates increased by 600% in less than a year, and the Affordability Index plummeted.
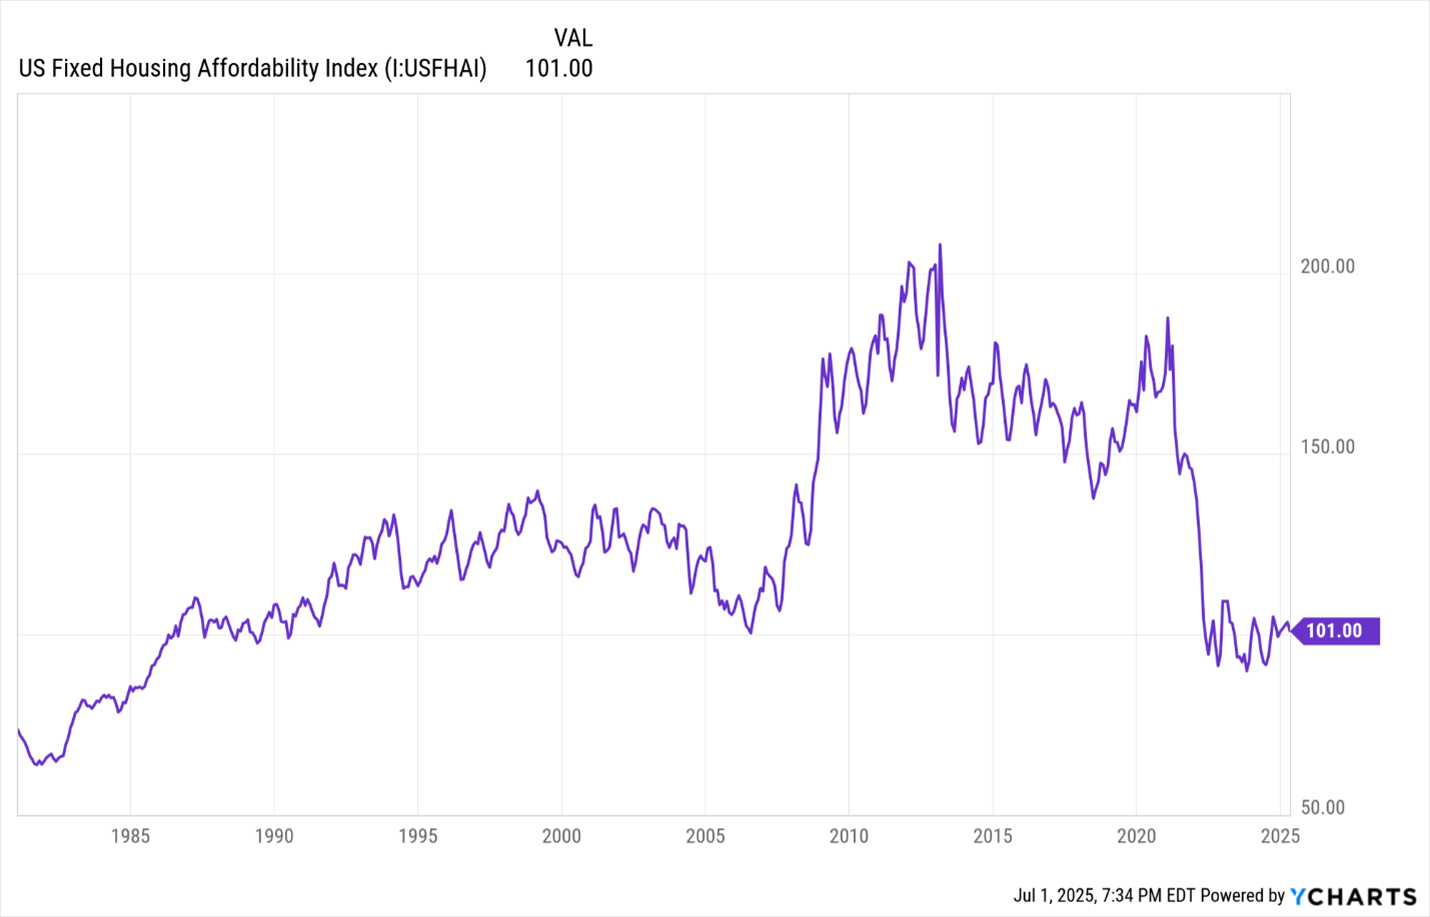
However, notice that the index has stabilized at 101, which means the national average income is still 101% of the required income to buy a national average-priced house. Currently, the national average price for existing homes is $422,800 and $497,700 for new homes.
I would be concerned that the housing slump of activity would continue if the Affordability Index were below 100. But it has stabilized around 100 and is currently at 101. Therefore, my assessment of the current sluggish housing market is the result of buyers hoping that mortgage rates will drop back and possibly to below 5%. Housing prices are holding steady and, in some regions, increasing. I would anticipate the housing market activity to increase going forward, even with the slightest decline in mortgage rates. Housing may possibly see a noticeable rise in activity beginning in the first half of 2026. The probability increases if the Federal Reserve lowers the discount benchmark interest rate or if there is a decline in income tax rates as proposed by the Trump administration.
What Does This Mean to Me?
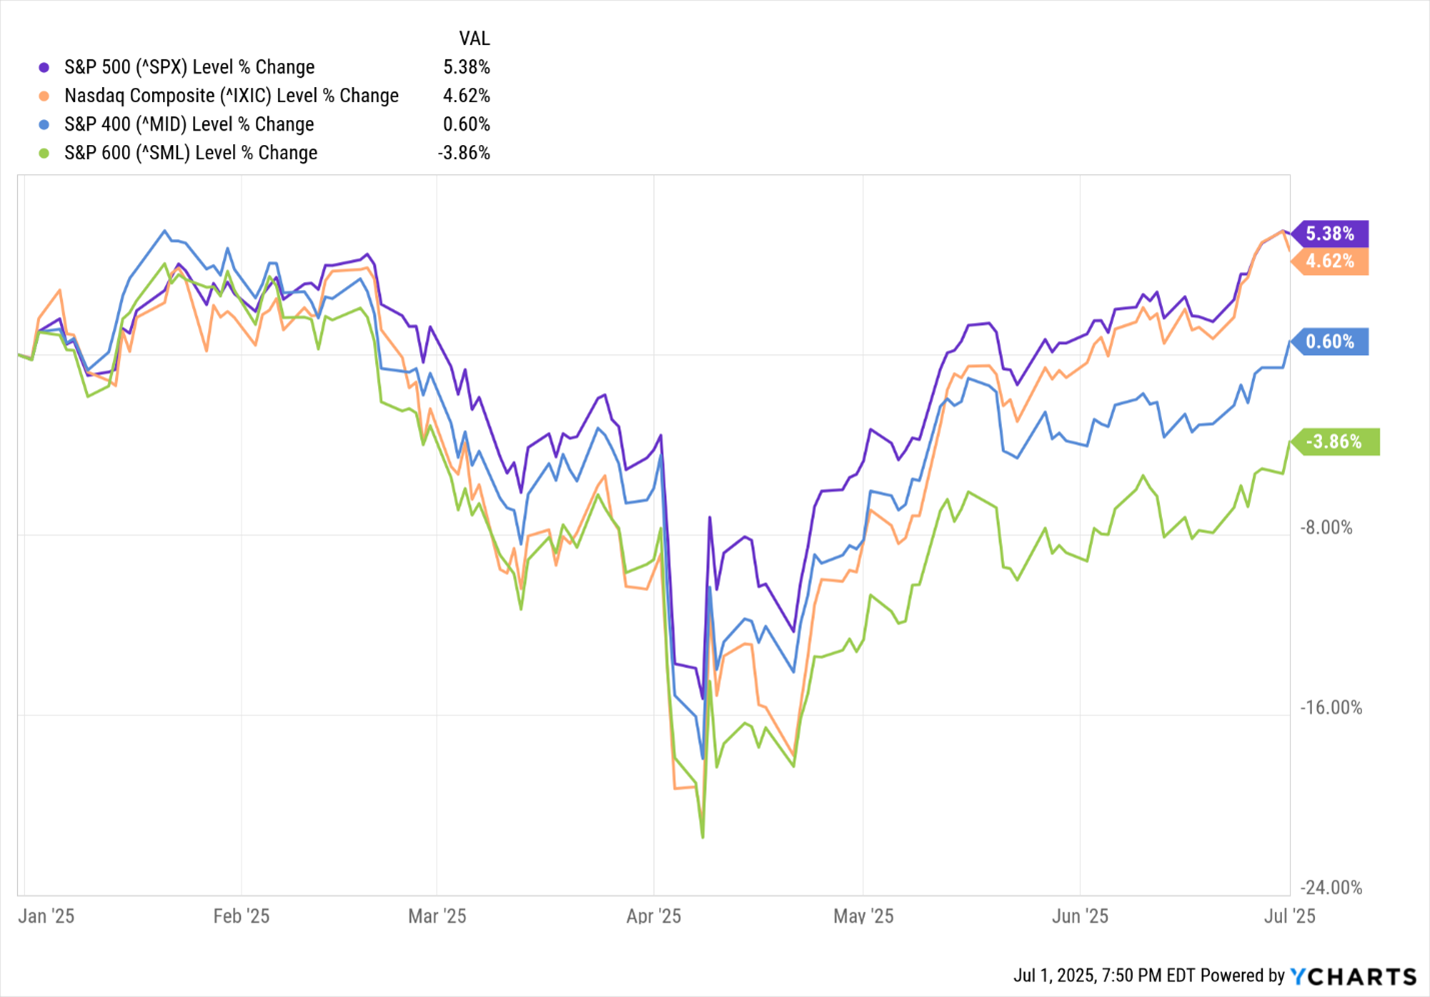
While the housing market remains stagnant, the stock market has had a remarkable bounce back since April, when President Trump announced new proposed tariffs. Except for the S&P 600 Small Cap index, the other major indices have fully recovered from the April selloff and now have a positive return YTD. Although the S&P 500, a large company index, leads NASDAQ so far in 2025, I would anticipate the tech index to end the year with a superior return.
We hold our favorable rating on the US economy and stock market. Give us a call if you have any questions about this Weekly UPdate. Now, at the halfway point of the year, this is an excellent time for a mid-year financial review to determine options to potentially improve your progress towards your financial goals. Give us a call to schedule your appointment for this review.

Anton Bayer
Back to Blog