

Cost of Goods Annual Increases are Finally Slowing
Weekly BriefJuly 15, 2025•4 min read
Today, the US Bureau of Labor Statistics announced the Consumer Price Index (CPI) for the month of June had increased to 322.56 points or 0.3%. On an annual basis, the annual inflation rate has increased to 2.7% which is the highest annualized rate since February’s low reading of 2.4% annualized rate.
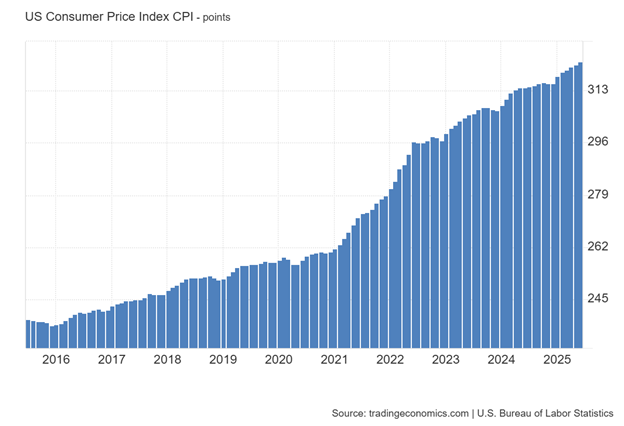
You notice from the above CPI chart that there is a substantial increase in the cost of goods and services starting in late 2021. The significant increase is due to the trillions of dollars that flooded into the US economy providing individuals and businesses to drive prices higher. The rationale for the government subsidies was to offset COVID-related draconian policies instituted by the government and health agencies. The policies restricted business operations and social activity to limit the spread of the COVID-19 virus and subsidized the decline in commerce with government funding. Americans keep the economy going with creative ingenuity to work around the restrictions and retain a large portion of government funding. The result was a significant increase in cash savings among consumers and businesses. Prices soared in the years 2021 to 2023 at annualized rates not seen since the late 1970s and only began to slow due to the Federal Reserve’s aggressive interest rate hike campaign that began in March 2023. For the past two years, inflation has slowed to annual increases below 3% with the Federal Reserve’s ultimate target goal to reduce to 2% annual rate.
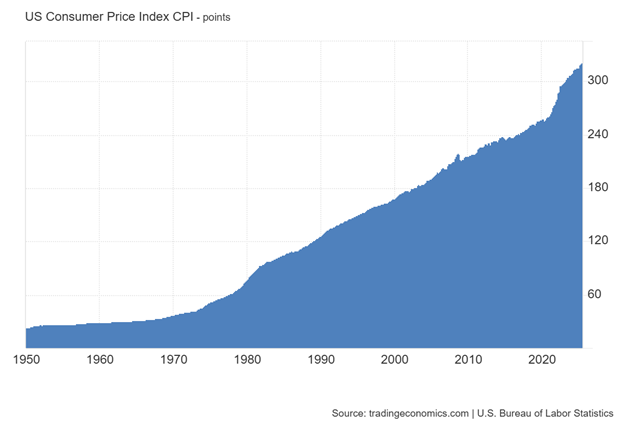
Expanding the CPI timeline of the chart to 1950, the significant annual increase of costs since 2021 is compared to the steady annual rate increase of costs since 1981.
The annual increases in costs are slowing, but barring a deep recession, costs will not revert to prices prior to covid. Fortunately for many Americans, this unique time offered the ability to lock in mortgage rates below 3% and pay down debts.
However, the cost of living has soared as inflation has substantially outpaced the rise in incomes. The Federal Reserve rate hike campaign slowed the annual rise of inflation, and over time, American household income will slowly catch up. In the meantime, many American households have been cutting back on many luxuries.
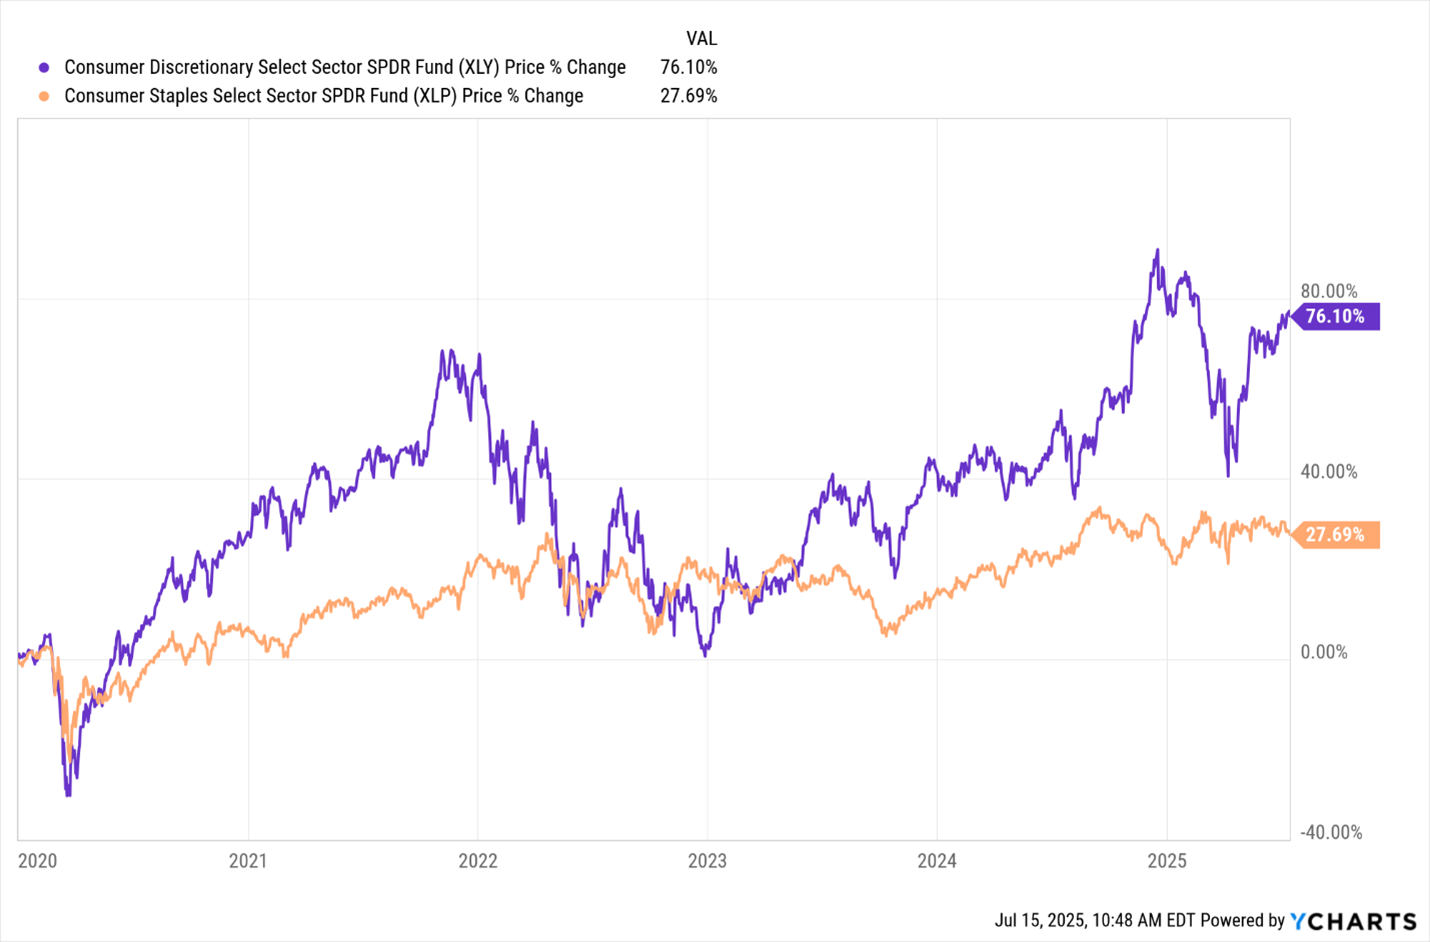
This has been apparent in the Consumer Discretionary Index ETF (XLY), which has been quite volatile, dependent on the consumer’s ability or willingness to spend. The chart below compares the Consumer Discretionary Index ETF and Consumer Staples Index ETF (XLP) since 2020. After XLY peaked in late 2022, the index plummeted to its lowest level by January 2023 due to rising interest rates. The index rallies again to new record levels in December 2024, only to plummet again due to the risk of rising prices from new tariffs in 2025. As consumers eased their concerns about tariffs, consumer discretionary spending has resumed, and the index has rallied but remains below its previous all-time high. Compared to the Consumer Staples Index ETF, the ride for staples has been much steadier, albeit with lower returns.
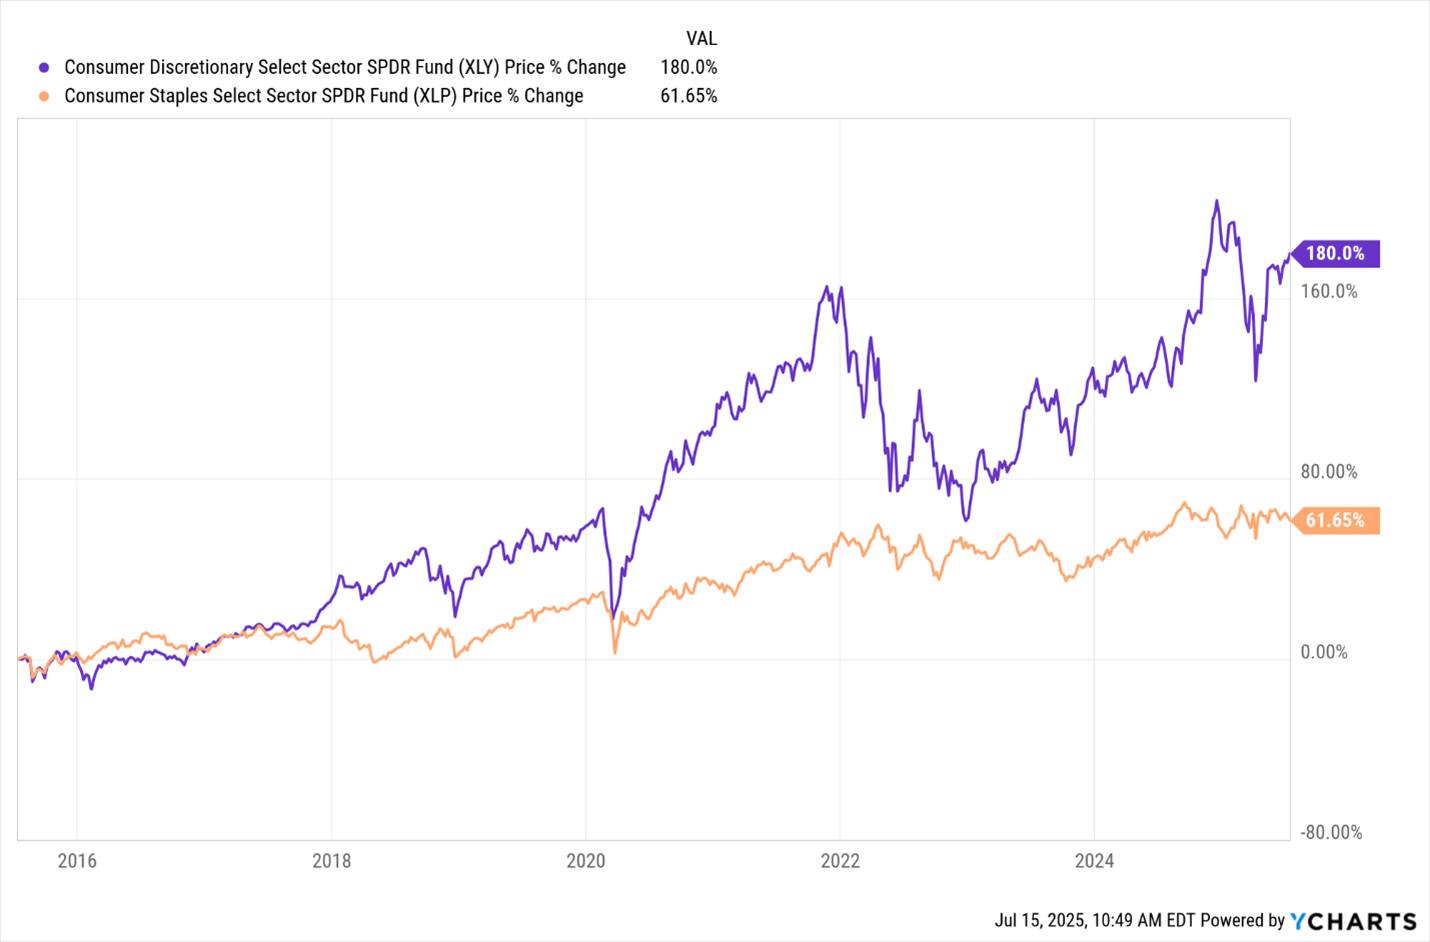
However, despite the volatility of XLY, the return for investors has significantly favored XLY over XLP since its inception in 1998 by nearly 300%.
What Does This Mean to Me?
The US economy and American consumers have experienced significant changes and volatility since 2020. The flooding of trillions of dollars into the economy, followed by a 500% increase in mortgage interest rates, while incomes slowly rise to catch up with costs. Thankfully, more Americans remain employed in history with over 6 million more jobs than applicants. The Federal Reserve rate hike campaign slowed the rapid rise in costs, which is now at a more sustainable annual pace below 3%.
Assuming no more major shocks to the economy, household income may continue to outpace inflation and increase net discretionary savings. Investors have relaxed their concerns about Trump tariffs and returned to buying stocks. The passage of the new budget removes the risk of rising taxes for Americans and businesses. This sets up for a potentially favorable second half of 2025 for the US economy and stock market.
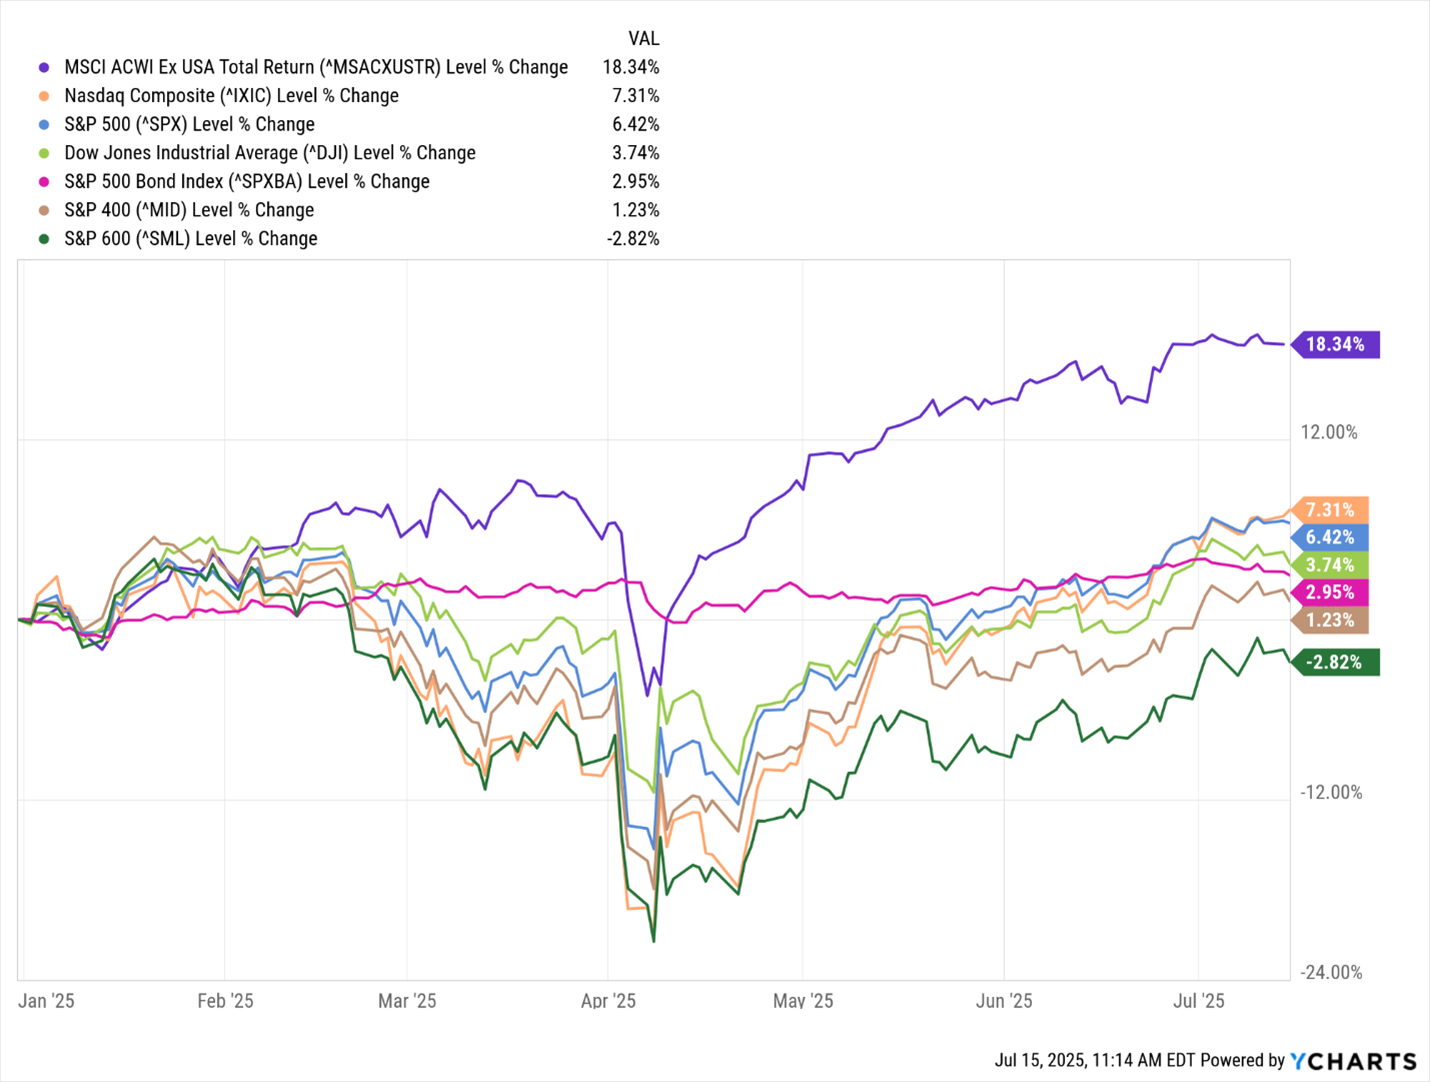
The S&P 500 and NASDAQ recovered from the deep selloff in April and now both have positive returns YTD. The MSCI Ex US index is significantly outperforming the S&P 500 and NASDAQ indices for the first time this century. The small and mid-cap sectors remain out of favor with institutional investors, and both have underperformed the bond index YTD.
Below is an outline of the YTD returns of these major indices.
MSCI Ex US: 18.34%
NASDAQ: 7.36%
S&P 500: 6.46%
Dow Jones Industrial Average: 3.82%
S&P Bond: 2.94%
S&P 400 Mid Cap: 1.27%
S&P 600 Small Cap: -2.78%
We maintain our favorable rating on the US economy and stock market. We continue to overweight large-cap and technology. The mid-cap and small-cap continue to underperform with a lack of institutional support. Despite the strong rally of the MSCI Ex US, it remains to be seen if institutional support continues with the recovery of the US dollar and stock market.
Let us know your thoughts on this Weekly UPdate or any other questions you may have about your own finances.

Anton Bayer
Back to Blog