

Weekly BriefJanuary 28, 2026•6 min read
Since 1972, the University of Michigan has surveyed approximately 1,000 households each month to produce its Consumer Sentiment Index. The index ranges from 0, representing extreme pessimism, to 110, reflecting peak optimism. Over its 73-year history, the median reading has been 80, a level generally associated with modestly positive consumer sentiment. These monthly reports have been a cornerstone of our Weekly Updates for over 20 years.
From 2016 leading up to the 2020 pandemic, the Consumer Sentiment Index was well above 80 with readings in the mid to high 90’s and some months approaching 100 as consumers were reporting very high optimism on the prospects of their finances and the economy. However, since 2020, consumers have been severely challenged and seemingly can’t get their mojo back after five very challenging years.
The “good times” feeling was quickly deflated in 2020 as the coronavirus pandemic spread around the world. The Consumer Sentiment Index quickly plummeted to levels below 70. Throughout 2020 to 2021, consumers reported their frustrations with draconian government policies and their fear of worldwide economic collapse, spurred by the constant negative messaging by major media and health agencies. Consumer Sentiment dropped to levels not reported since the 2008 Great Recession.
As good news that the feared death rate from the coronavirus appeared to be overstated, inflation roared to levels not seen since 1979. The Federal and state governments flooded billions of dollars into the economy to soften the financial damage of their restrictive policies, creating a significant imbalance of supply and demand. Prices soared as too much money was chasing after too few goods, exacerbated by reductions from supply chain disruptions.
The Federal Reserve stepped in March 2022 to slow the now out-of-control rise in prices with an aggressive interest rate hike campaign to slow consumer spending and borrowing. The campaign worked, crashing the real estate housing market as 30-year fixed mortgage rates soared from a low 3% range to above 8%. The rise in mortgage rates nearly tripled the lending cost to buy a home and still remains at significantly higher rates to this day.
The chart below illustrates the 73-year history of the rise and fall of the index, ranging from high optimism above 80 to near depression levels below 50. During the 2008 Great Recession, consumer sentiment dropped to record lows. However, these 2008 low levels were breached as consumers reported in 2022 to 2023 even dire outlooks. The sentiment index dropped to record levels, even below the 2008 period when the US financial markets were truly at risk of an economic collapse.
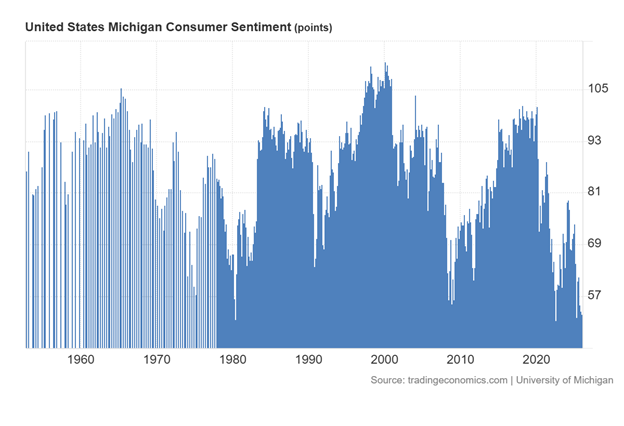
However, consumer sentiment has slowly been recovering with three consecutive monthly improvements of the index.
Joanne Hsu, Director of Surveys of Consumers, provided this commentary for this month’s report.
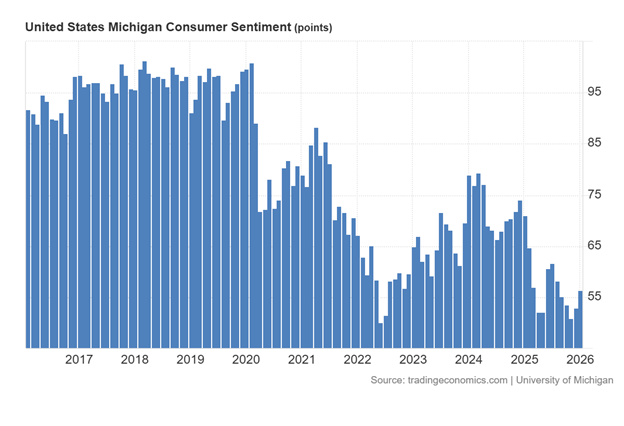
“Consumer sentiment lifted about 3.5 index points this month, with minor gains seen across all index components. While the overall improvement was small, it was broad-based, seen across the income distribution, educational attainment, older and younger consumers, and Republicans and Democrats alike. However, national sentiment remains more than 20% below a year ago, as consumers continue to report pressures on their purchasing power stemming from high prices and the prospect of weakening labor markets. Aside from tariff policy, consumers do not appear to be connecting foreign developments to their views of the economy. Note that interviews for this release concluded on January 19th, two days after Trump’s social media post announcing additional tariffs on eight countries in Europe.”
The Index has risen to 57, but is well below the long-term average of 80. As Ms. Hsu noted, this month’s survey was after President Trump’s posting of new tariffs along with demands that Greenland surrender its sovereignty to the US. The index may be backtracking in February. The chart below represents the past 10 years and illustrates the very high optimism leading up to the pandemic and how consumer sentiment hasn’t recovered even close to the levels prior to 2020.
Despite the low sentiment levels of consumers, holiday retail sales exceeded what many projected to be the first season of year-over-year decline in sales. Consumers may be discouraged, but it didn’t stop them from buying gifts for friends and family.
Consumer Affairs reported on December 29, 2025, that US Holiday sales could exceed $1 trillion for the first time in history. Estimates are that the 2025 retail sales increased approximately 4% year over year. James Hood, founder and editor of Consumer Affairs, offered this analysis:
“Visa and Mastercard reported this week that retail spending from early November through Dec. 21 rose about 4% over last year, with electronics, apparel, and online orders among the strongest categories. Adobe Analytics likewise forecasts that online holiday sales will pass $250 billion, up more than 5% year over year.
The National Retail Federation (NRF) has projected overall November-December sales growth between 3.7% and 4.2% — enough to push total spending over the trillion-dollar mark for the first time.
Shoppers focus on value amid economic uncertainty.
While totals are rising, analysts say the gains reflect a mix of bargain-hunting, deep discounting, and heightened price sensitivity rather than broad consumer exuberance. Surveys from Gallup and others show Americans budgeting carefully and planning to spend roughly the same amount on gifts as they did last year.
Consumers are shifting more purchases to discounters, off-price chains, and online platforms, while secondhand and resale markets have posted above-average growth. Retailers, anticipating cautious buyers, began rolling out aggressive promotions earlier in the season and continue to offer steep markdowns as Christmas passes.”
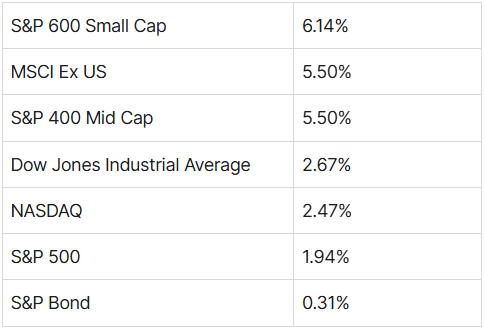
The strong holiday season has set up for a positive start in 2026. Many of the major international stock market indices continue to outperform the US indices. For the first time in more than a decade, the S&P 600 Small Cap index is leading the major indices YTD. Both 2025 leaders of the S&P 500 and NASDAQ are trailing again behind the MSCI EAFE ex-US index. Below are the YTD returns of the major indices through today and the related chart:
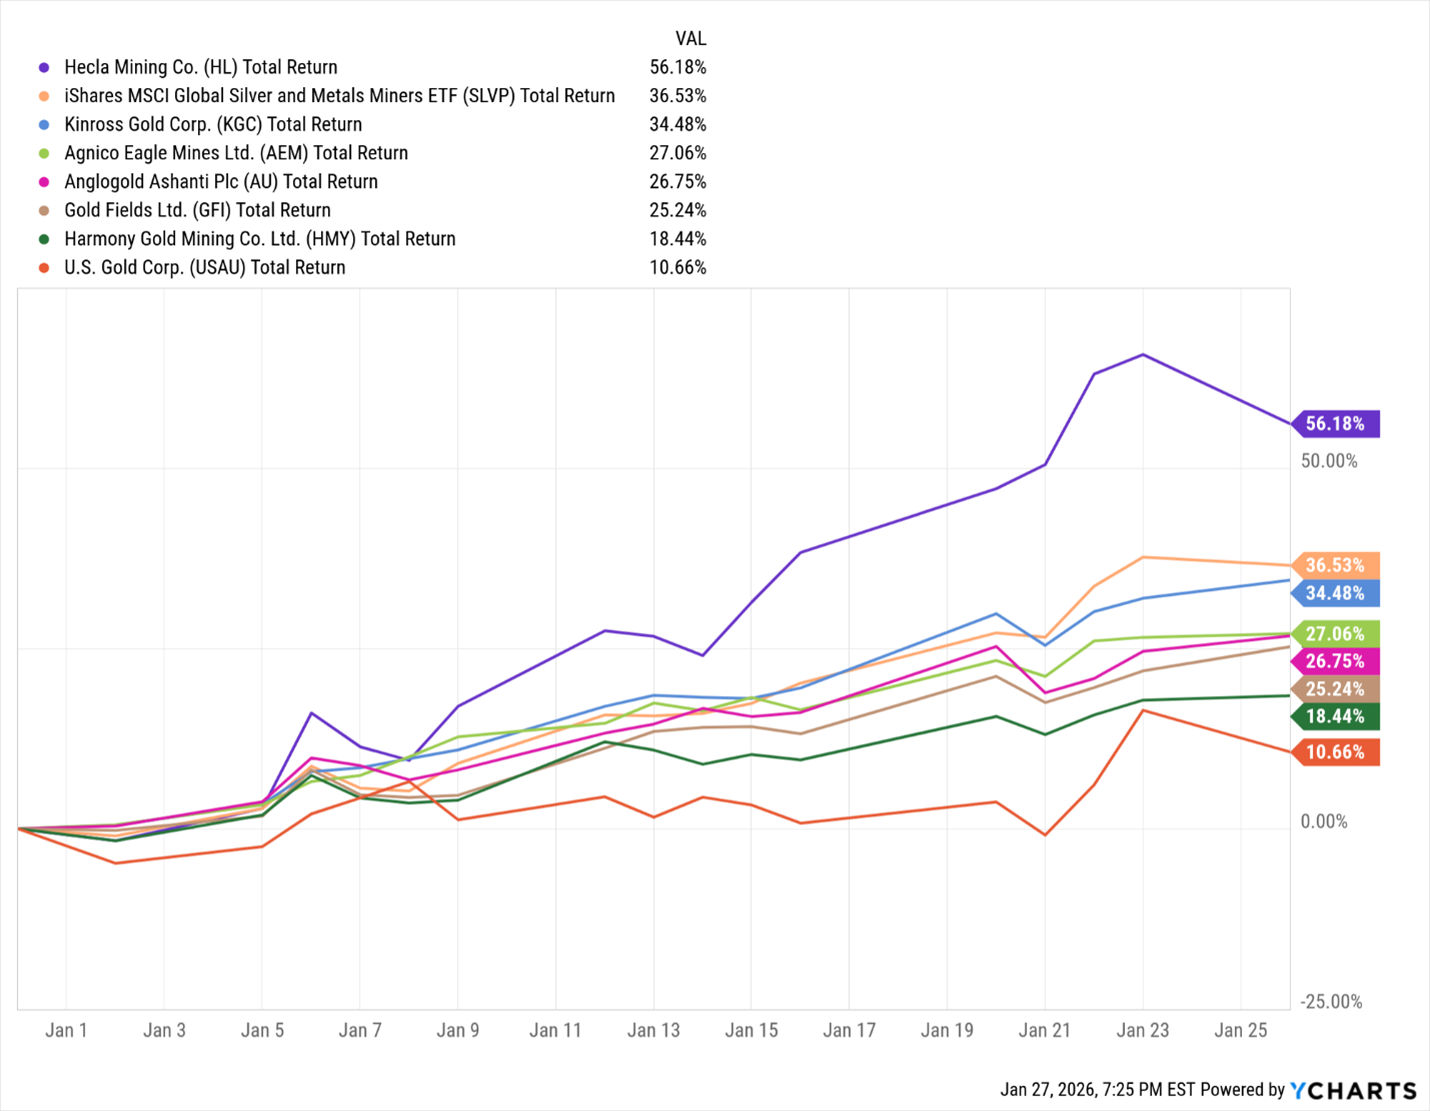
Even with the positive start of equity markets, the fear sentiment is running high as investors are buying precious metals to hedge their risks. The precious metals market and mining stocks are soaring to all-time highs, significantly dwarfing the returns of US indices. It is hard to predict how much further this sector can rally. Currently, there is no sign of investors beginning to take profits. Below is a chart of several of the mining and precious metal ETF’s that include those in our portfolio:
We maintain our favorable view of the US economy and stock market. Let us know if you have any questions about this UPdate or your financial planning. We welcome the opportunity to assist you and your family in achieving your goals.

Anton Bayer
Back to Blog