
BLOG

Why Does the Stock Market Keep Going Up?
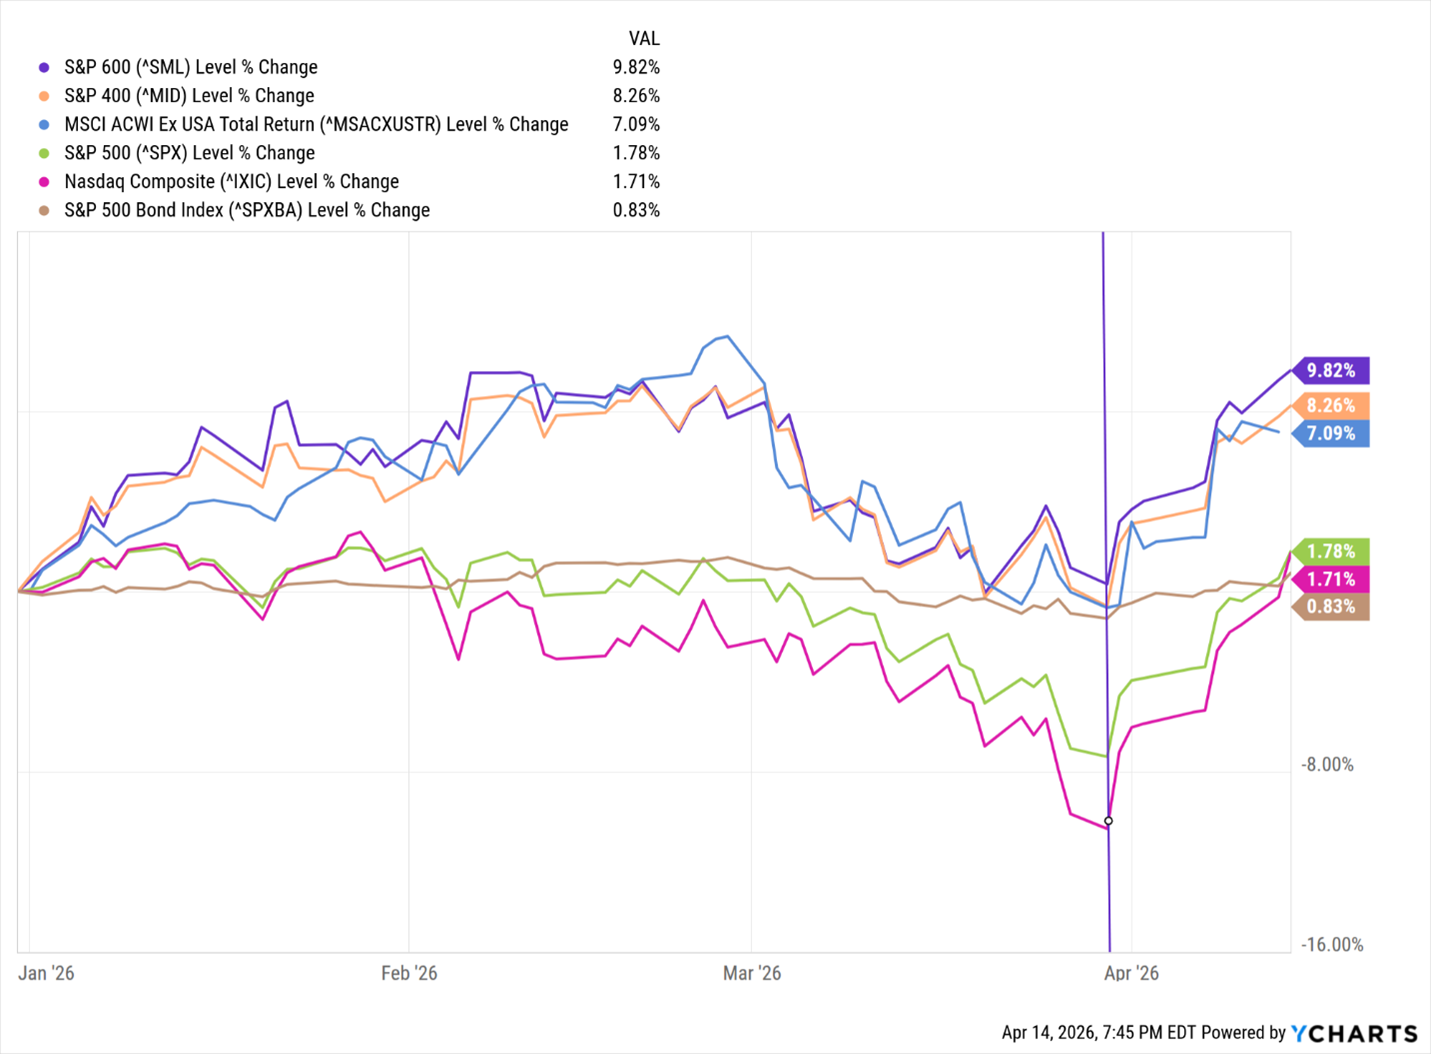
Clients have recently been asking why we rebalanced our model portfolios on April 1 to invest the large cash position back into equities that included gold miners. This rebalance was timely as global and US stock markets bottomed on March 30 and have staged a robust rally since (see YTD chart below with line indicating March 30).
The underlying question is why are stocks rising even as uncertainty increases regarding Trump, the U.S. economy, oil prices, rising costs, and war with Iran? These are major issues that one would expect investors to be selling to reduce risks, and institutional investors are doing the opposite. Why are investors behind the stock market rally trend not deterred by the rising global tensions and risks of an energy crisis not seen since 1972?
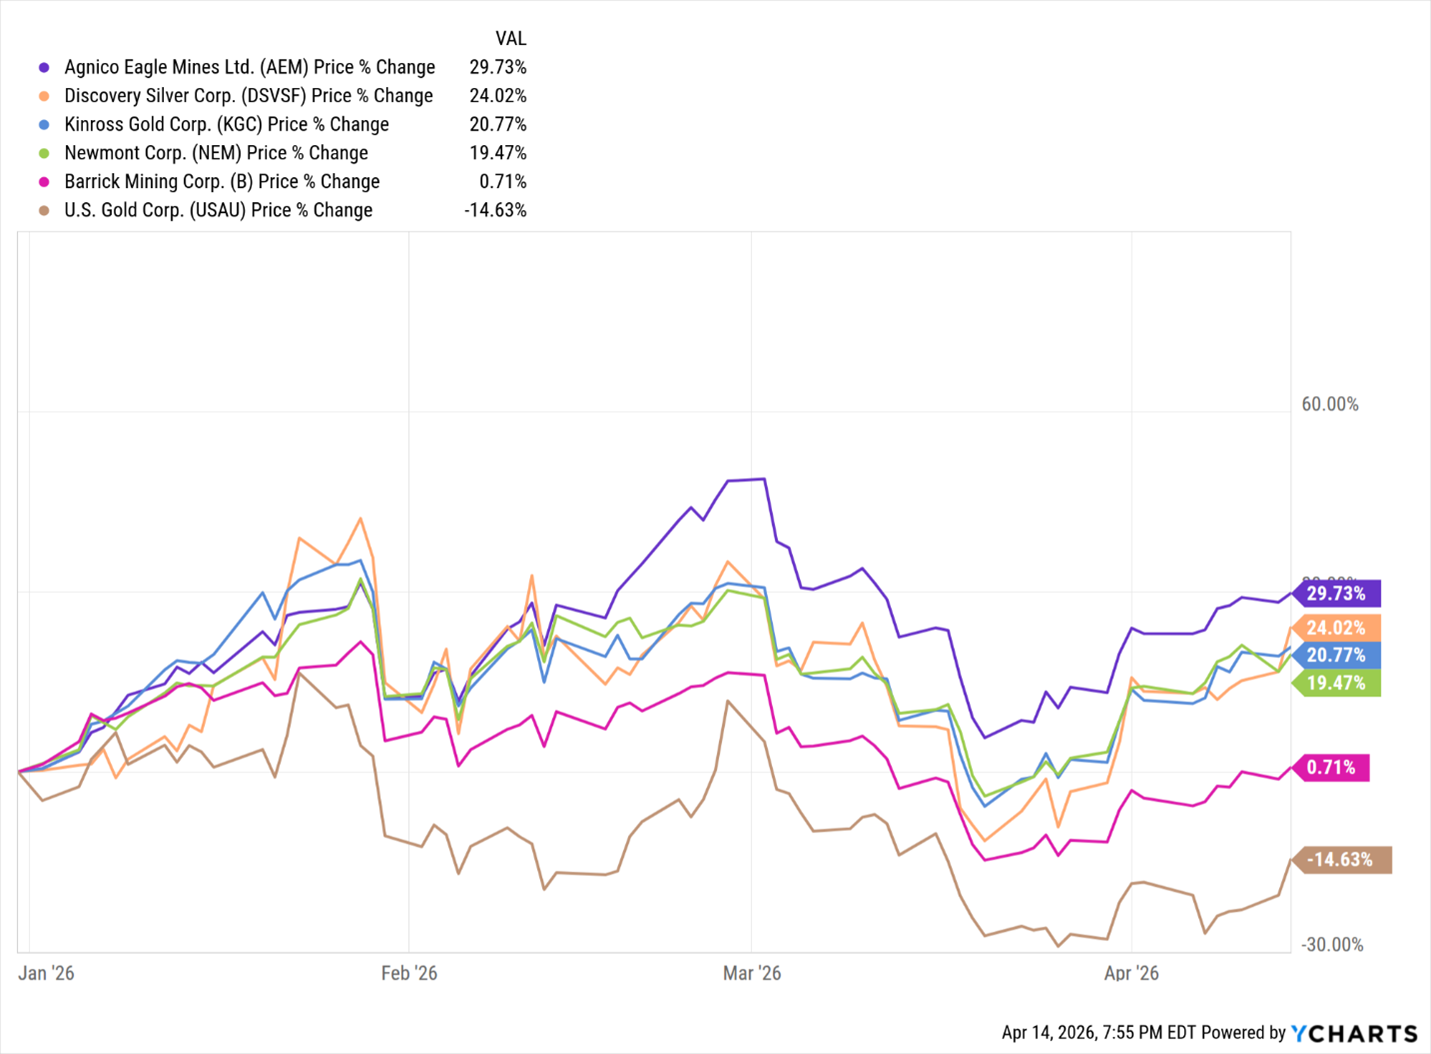
Equally puzzling is the recent trading activity of precious metals. Gold and silver declined almost 20% in February and March, despite the U.S. initiating direct attacks on Iran on February 28. Gold and silver are typically viewed as hedges against risk, yet as geopolitical tensions rose and the U.S. stock volatility index climbed, precious metals plummeted in value as investors sold their metal and miner holdings aggressively. Note the chart below that illustrates several leading gold and silver mining companies that had lost all the year’s gains by late March.
I understand the frustration of investors who moved to cash in January in response to these risks, only to watch global equity markets fully recover their earlier losses and now push toward potential all-time highs. As of yesterday, all major indices were positive year to date. The rally continued today, with the S&P 500 and NASDAQ gaining 1.18% and 1.96%, respectively.
To make sense of this, it helps to draw on years of investing experience, understanding the media, and most importantly, insight into how institutional investors behave. Let me break down these factors.
EXPERIENCE
I’ll admit, my first decade as a portfolio manager starting in 1997 captured both the best and worst of times. It was an era defined by extremes. After moving to San Jose (Silicon Valley), I joined an investment team at a portfolio management firm just as the buildup to the 2000 dot-com crash was gaining momentum.
The years leading to that crash were nothing short of meteoric. Our technology investments surged somewhat, rising 20% in a single day. It wasn’t just a handful of outliers; many stocks doubled or more within a year, and some far exceeded that. Initial Public Offerings (IPOs) routinely jumped over 100% on their first day of trading. My own portfolio, entirely invested in stocks, margin, and options, increased tenfold in just three years.
Then, just as I began to believe I had it all figured out, the market turned. In March 2000, stocks began a historic decline. The very strategies that had driven success throughout the previous decade suddenly produced devastating losses. Many investors and families faced severe financial hardship as private equity funding dried up, prompting tech companies to reduce staff or, worse, close. Individual stock portfolios and 401 (k) accounts plummeted in value. Unemployment escalated, and many formerly affluent families in San Jose were forced into bankruptcy all within a few short years.
Fortunately, in late 1999, my wife had the foresight to push us to stop renting, as home prices and rents were rising rapidly, often by more than 15% annually. After being outbid multiple times, we finally had our above-listing offer accepted in early 2000 for a modest but very expensive 40-year-old Cupertino home. We were bidding against 10+ other buyers, but the agent counseled her buyer to accept our offer even though it was not the highest. Our edge came from a common local strategy at the time: allowing the listing agent to represent both buyer and seller, which was framed to expedite closing. Though the incentive of a doubled commission proved to be a strong incentive.
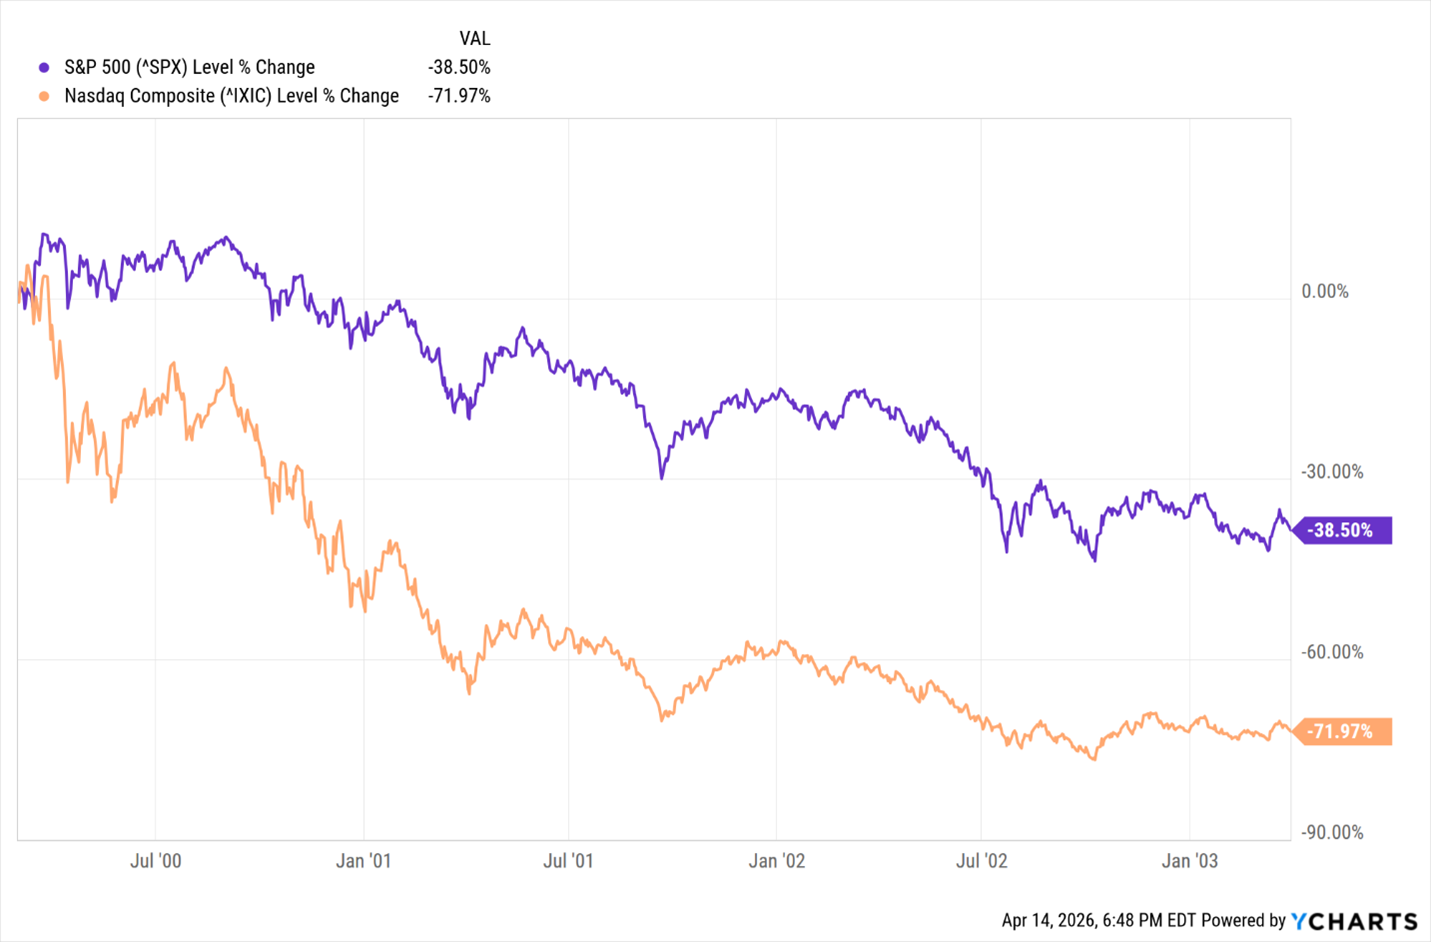
Anyways, with the grace of God along with my wife’s intuition, we missed the worst stock market crash since 1929. It quickly became clear to me that something fundamental had changed. The market dynamics that had prevailed since 1982 no longer applied. The ensuing selloff was relentless. From 2000 to 2003, the S&P 500 fell 38.5%, while the NASDAQ plunged nearly 72%.
This century the U.S. economy has endured multiple shocks that include multiple recessions, volatile interest rates, the 2007 housing collapse, the 2008 financial crisis, the worldwide pandemic, and another market downturn in 2022 that contributed to bank failures as bond prices fell sharply. Living through these cycles while identifying real risks, opportunities, and emerging trends builds a level of experience that simply can’t be learned from books.
Experiencing the dot-com boom of the 1990s helped prepare us for the sense of déjà vu we see today with the rise of artificial intelligence. NVIDIA, for example, has increased by more than 1,000% since we added it to portfolios in 2022, while Western Digital is up 35.4% this year. Each cycle teaches lessons. History serves as both a guide and, at times, a roadmap. Over time, you learn which indicators and sources offer reliable insight and which do not. That brings us to the role of the media.
THE MEDIA
One of the most important lessons I’ve learned over the past 28 years is that major network media outlets deliver selected information with a specific agenda. For investors, this can be either helpful or harmful, depending on how that information is interpreted. Most viewers consume financial news at face value, often unaware of the framing and intent behind it. This can lead to costly decisions.
After decades of closely following major media and even participating as a guest on CNBC from 2005 to 2010, I’ve gained insight into how these organizations operate. The most important aspect of my learning is that one CAN NOT follow the advice of correspondents and analysts of the major network media. Doing so can result in catastrophic losses.
Time and again, media narratives have misjudged recessions, overstated risks, missed market bottoms, and cast doubt on rallies. When markets pull back, bearish voices are quickly amplified, reinforcing the idea that gains are unsustainable. Inexperienced investors become doubtful and second-guess their convictions.
So why do major networks remain influential despite their poor track record? The answer is simple: fear attracts attention more effectively than greed. Media programming tends to skew negative because it keeps viewers engaged. A friend of mine is a North Bay Area 6:00 news anchor. My joke with him is “Who died today?” Nobody wants to miss the next disaster, market collapse, fraud, embezzlement, and all other horrors. It’s addictive, and it sells. Their specific goal is simple. Grow viewership and increase ad revenue. Not much more complicated than that.
That said, the media can still be useful if approached correctly. The data they present is often valuable. The problem lies in the conclusions, opinions, and advice layered on top. Media narratives can exacerbate emotionally driven market behavior, triggering panic selling (e.g., April 2025) or dampening rallies. But for those who understand these dynamics, the patterns are predictable and useful to those who understand.
INSTITUTIONAL INVESTORS
Institutional investors are large organizations that invest substantial amounts of capital on behalf of others. They dominate the market, and because of their size, resources, and influence, they often play a major role in driving market trends and pricing. Most importantly, they are the most informed investor players. They have at significant costs information from confidential sources to identify, sometimes within minutes, events that will impact investments.
Let’s identify these influential institutions:
1. Pension Funds
Manage retirement money for employees (e.g., public pensions, corporate pensions). They invest with long-term horizons.
2. Mutual Funds & Exchange Traded Funds (ETFs)
Pool money from individual investors and allocate it across stocks, bonds, and other assets (e.g., Vanguard, Fidelity).
3. Hedge Funds
Actively managed funds that use more aggressive strategies, including leverage, derivatives, and short-selling (e.g., Bridgewater, Citadel).
4. Insurance Companies
Invest premium income to meet future claims, often focusing on bonds and income-generating assets.
5. Endowments & Foundations
Manage funds for universities and nonprofits (e.g., Harvard Endowment), typically with long-term, diversified strategies.
6. Sovereign Wealth Funds
Government-owned investment funds managing national savings (e.g., Norway’s fund, Saudi Arabia’s PIF).
7. Banks & Investment Banks
Trade and invest capital directly or on behalf of clients, often influencing liquidity and short-term market movements (e.g., Goldman Sachs, JP Morgan, Wells Fargo, Chase)
8. Private Equity & Venture Capital Firms
Invest directly in private companies or buy out public companies (e.g., Blackstone, Sequoia).
We may never fully know the specific information that drives institutional investors to buy or sell, but tracking their activity can offer valuable insight into the direction of market trends. This group has demonstrated an impressive ability to anticipate outcomes, often months in advance, on major events such as presidential elections, geopolitical developments, shifts in interest rates and inflation, and even the outcome of wars.
We don’t know why this group is currently so optimistic about the favorable conclusion of the Iran war and opening of the Strait of Hormuz, but their trading indicates it will come to fruition sooner rather than later. This is why we rebalanced our portfolio on April 1. I don’t know what institutional managers know, but I do know they are buying.
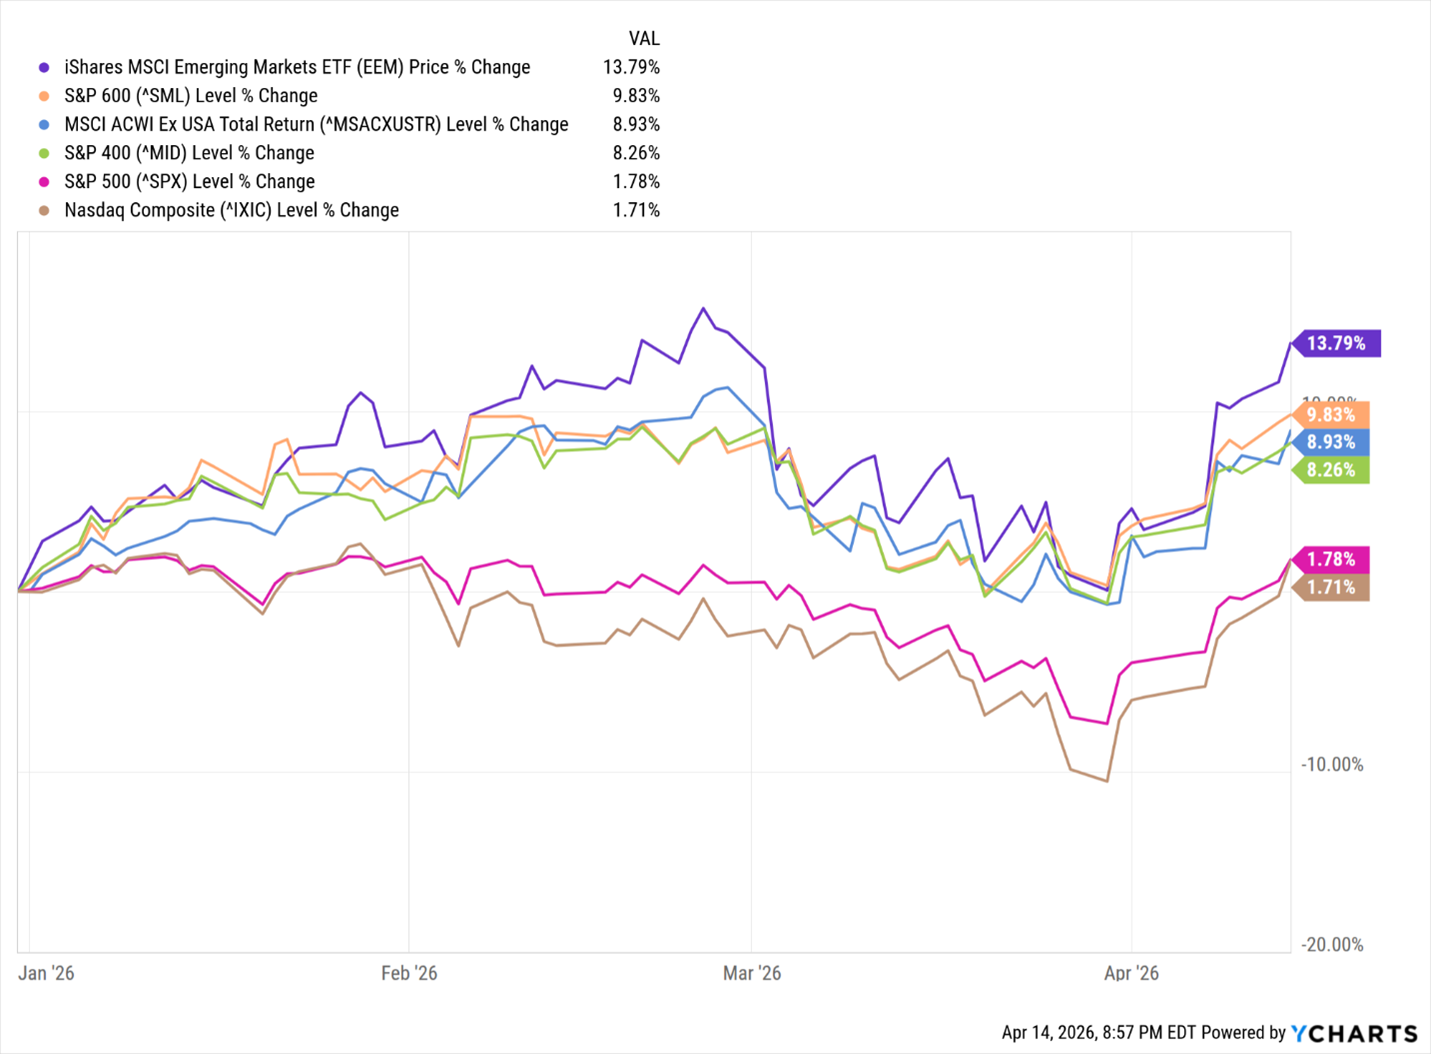
It's also important to monitor what they are buying. Since the start of the year, their focus has expanded from technology and large US companies to smaller companies and international companies. As illustrated earlier, the S&P 500 and NASDAQ have increased this year by 1.78% and 1.71%. That compares to this year’s new leaders of the emerging markets (EEM) + 13.79%, S&P 600 (Small Cap) +9.83%, and large international (IEFA) + 8.93%. A significant reversal considering their almost 50% less return to the S&P 500 and NASDAQ indices since 2018.
What Does This Mean to Me?
Despite the relentless negative messaging from major media outlets, institutional investors have been steadily allocating capital into equities since April 1. While we may not know what information they are acting on, their behavior is clear that they are buying. This activity prompted us to rebalance our portfolios also on April 1, returning to our growth allocations. So far, that decision has proven timely, as both U.S. and global equity markets have rallied, reflecting renewed optimism about the near-term outlook.
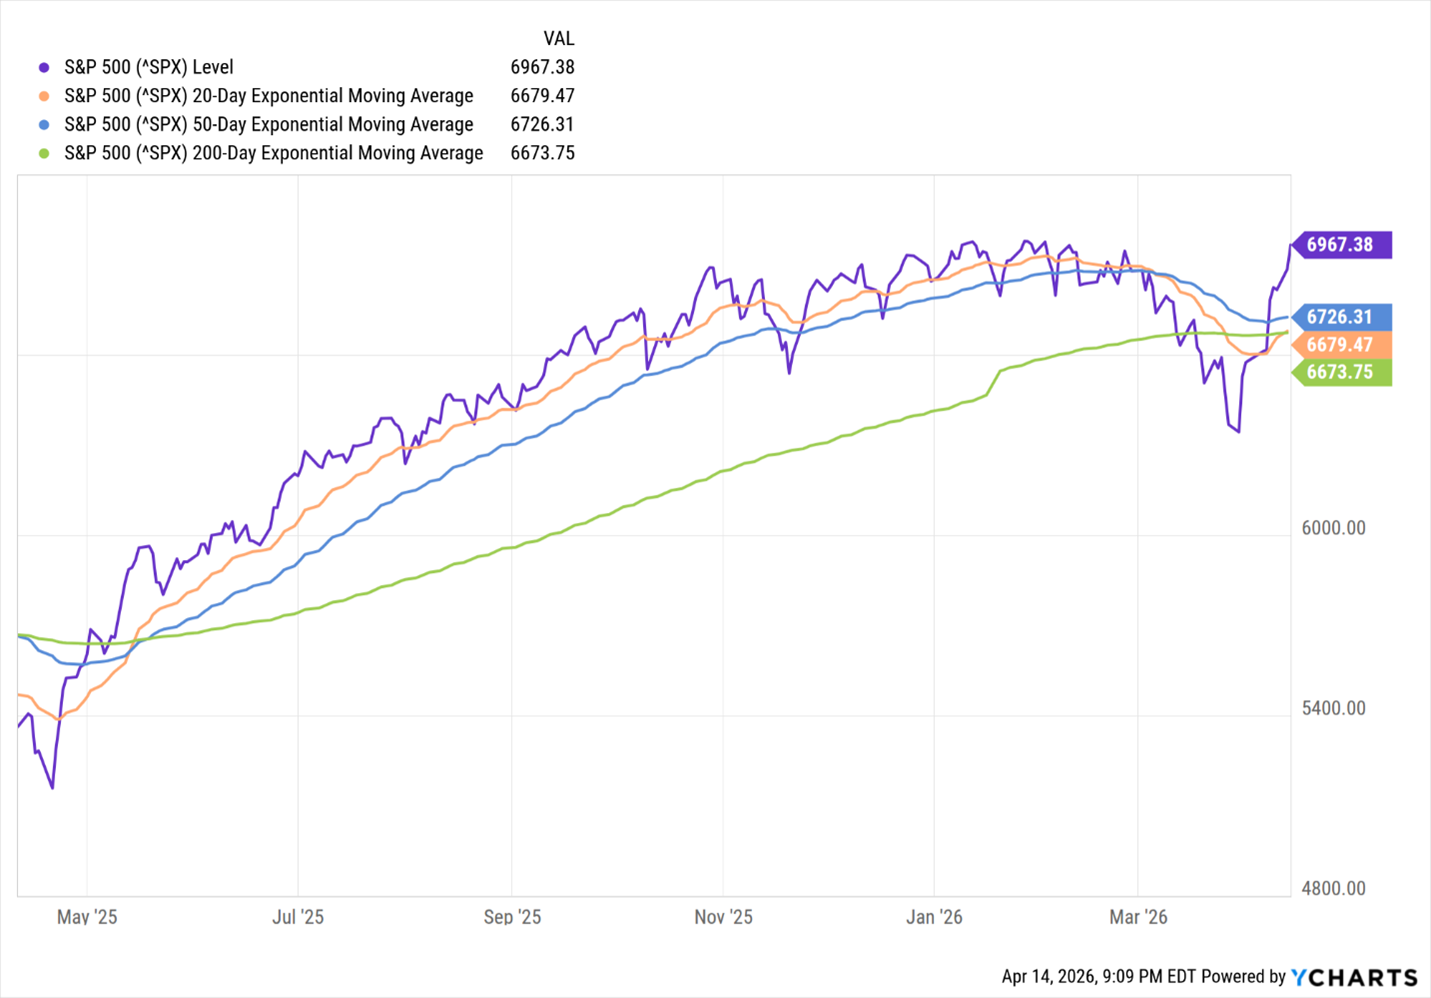
The next step is confirmation. We are closely monitoring technical and economic indicators to support the sustainability of this trend. From a technical perspective, a key signal is whether major indices, particularly the S&P 500, remain above their 20-, 50-, and 200-day moving averages (DMA). The recent rally has pushed the S&P 500 above all three levels. If this trend continues, we expect a bullish formation, with the 20-day moving average above the 50-day, and the 50-day above the 200-day. Currently, this is not the case, as illustrated below.
On the economic front, we are monitoring a broad set of indicators to reinforce confidence in the rally. These include consumer spending, job growth, corporate profit margins, the Consumer Price Index, lower 10 Year Treasury yields, and, ideally, an improvement in currently weak consumer sentiment.
We will continue to provide weekly UPdates as these key indicators evolve and help determine the durability of this market trend. Please feel free to reach out with any questions about this UPdate. As always, we are here to support you and your family in achieving your long-term financial goals.

CONTACT
Check the background of your financial professional on FINRA's BrokerCheck.
The content is developed from sources believed to be providing accurate information. The information in this material is not intended as tax or legal advice. Please consult legal or tax professionals for specific information regarding your individual situation. The opinions expressed and material provided are for general information, and should not be considered a solicitation for the purchase or sale of any security.
We take protecting your data and privacy very seriously. As of January 1, 2020 the California Consumer Privacy Act (CCPA) suggests the following link as an extra measure to safeguard your data: Do not sell my personal information.
The information on this website is the opinion of Up Capital Management and does not constitute investment advice or an offer to invest or to provide management services. Before purchasing any investment, a prospective investor should consult with its own investment, accounting, legal, and tax advisers to evaluate independently the risks, consequences, and suitability of any investment.
Copyright 2024 | Privacy Policy | Terms & Conditions