
BLOG
Santa Claus Barometer for 2026
Many years ago, Simon Maierhofer, founder and editor of the iSpy ETF Newsletter, introduced me to a powerful market framework. Simon is one of the most analytically rigorous market observers I’ve ever met, with a unique ability to extract meaningful signals from equity market data.
He shared a combination of three market barometers that, taken together, have shown intriguing results in anticipating the S&P 500’s performance for the year ahead. These indicators track how the S&P 500 behaves during very specific trading windows surrounding the end of one year and the beginning of the next.
Together, these three periods form what is known as the “Santa Claus Barometer.” It is designed to measure investor sentiment and market momentum as one year closes and a new one begins to potentially indicate the subsequent year’s direction.
The specific trading days that make up the Santa Claus Barometer are:
Santa Claus Rally (SCR) – Last 5 trading days of December and first two trading days in January
First Five Business Days of Current Year January (F5D)
Current Year January (Jan)
Certain combinations of returns across these three periods have shown a remarkably strong record in forecasting the S&P 500’s performance in the year ahead. Since 1970, there have been only 20 instances in which all three periods produced positive returns. In every year except for 2018, when the market fell 6.24%, the following year delivered a positive return for the S&P 500. Those gains ranged from just 0.1% in 2011 to an impressive 34.1% in 1995, with an average return of 17.7%. The most recent example occurred in 2023, when the S&P 500 surged 24.23%.
By contrast, the Santa Claus Barometer for 2025 did not offer a clear signal. While the S&P 500 finished 2025 with a solid annual gain of 16.39%, the individual components of the Santa Claus Barometer delivered mixed results, preventing a clean directional reading going into the year. Below are the returns for these three key periods for 2025:
SCR: -0.5%
F5D: 0.6%
Jan: 2.60%
However, looking back to 1970, there were only two other occurrences when the S&P 500 was negative for the SCR, positive for the F5D, and in the month of January. Below is how the S&P 500 performed in the following year with this combination for the Santa Claus Barometer:
1980: 25.8%
1994: -1.50%
2025: 16.39%
So, how are the indicators looking for 2026? Well, we still need to finish January to complete the Santa Claus Barometer. Here is how the first two periods finished:
SCR: -0.4%
F5D: 1.10%
Jan: ?
For speculation purposes, if the month of January ends with a positive return to complete the Santa Claus Barometer, two out of three times since 1970, the S&P 500 has had robust returns. Even if January ends with a negative return, this combination of negative SCR, positive F5D, and negative January has only happened three times since 1970, and all three times the S&P 500 had a positive return for the year, from 0.73% (2015) to 9.55% (2016).
We will report back to you on the first of February on the final numbers of the Santa Claus Barometer and what history indicates for 2026.
Below is the reference table going back to 1970 outlining the performance of the S&P 500 for each of these periods.

What Does This Mean to Me?
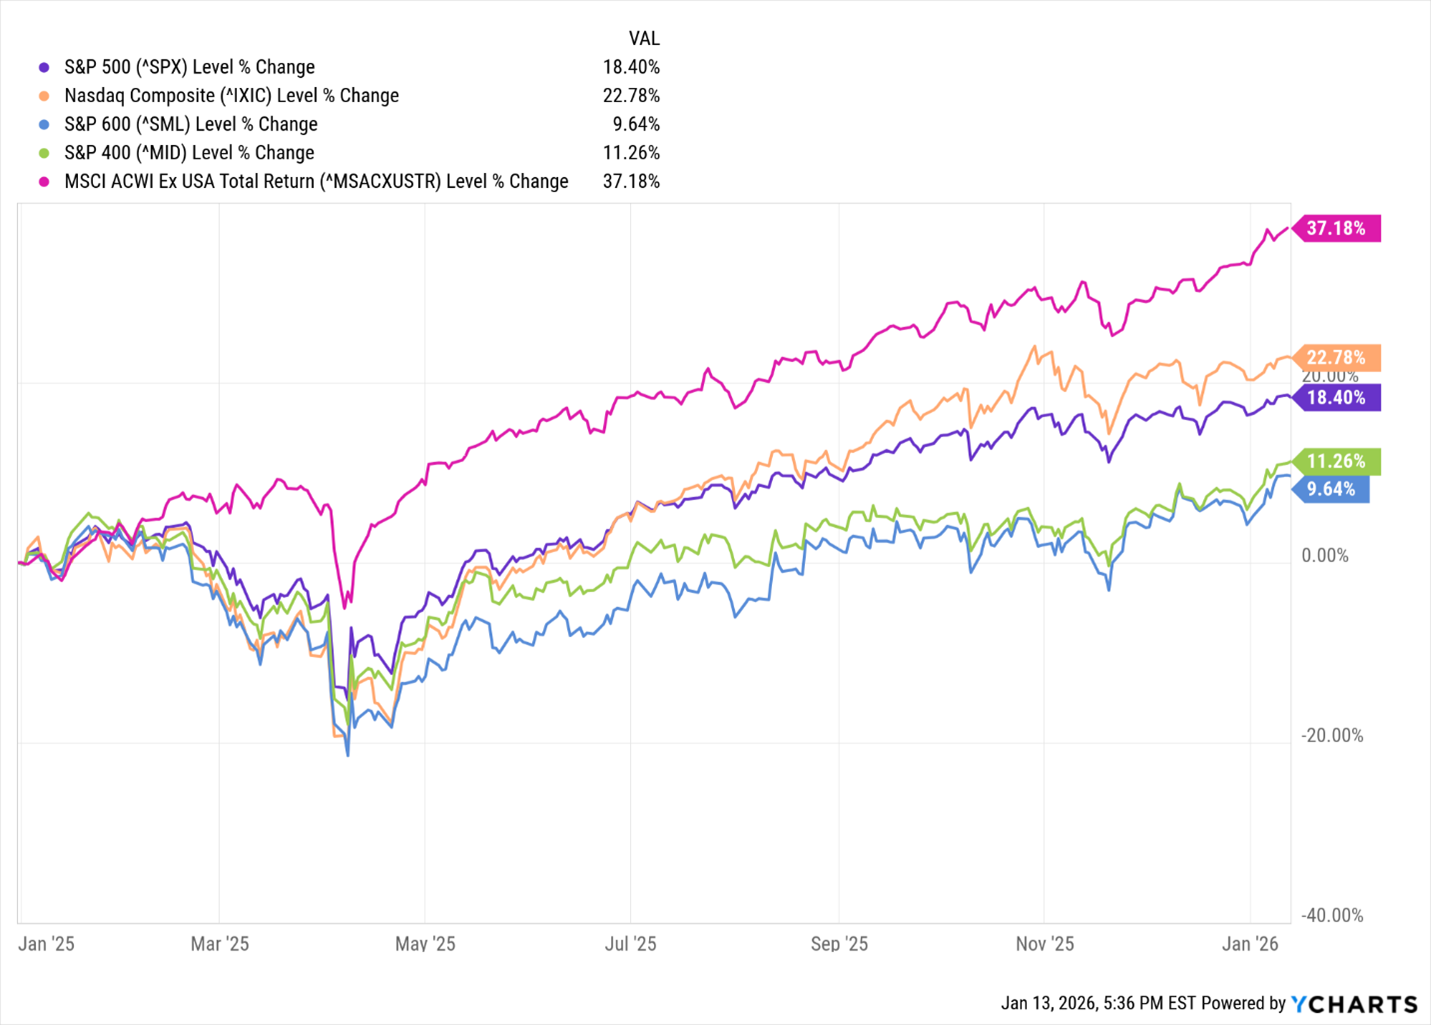
Throughout the last year, we maintained our favorable rating on the US economy and stock market. Institutional investors started the year in a dire mood with the US major indices trending down from the start of the year. Then panic selling began on April 2 as a result of analysts forecasting a worldwide economic crisis due to Trump’s new tariff policy. Considering the severe alarms by analysts, the panic selling ended only a few days later, on April 9, as investors quickly reversed to become aggressive buyers. The amazing turn of events in just a few days in April should be an indication of how important it is not to get swept up in media frenzy. For those not as nimble as institutional investors who sold during these panic-selling days and didn’t rebuy, it had to be difficult to watch the stock market soar to all-time highs, waiting for the forecasted economic collapse.
We maintain our favorable view on the US economy and stock market for 2026. In Updates and podcasts this year, we look forward to providing you with regular analysis of the economy and stock market. Our goal for the past 25 years we have been publishing is to provide you with accurate indications of current events. For now, the same positive factors in the economy that propelled the stock market last year still exist for 2026.

CONTACT
Check the background of your financial professional on FINRA's BrokerCheck.
The content is developed from sources believed to be providing accurate information. The information in this material is not intended as tax or legal advice. Please consult legal or tax professionals for specific information regarding your individual situation. The opinions expressed and material provided are for general information, and should not be considered a solicitation for the purchase or sale of any security.
We take protecting your data and privacy very seriously. As of January 1, 2020 the California Consumer Privacy Act (CCPA) suggests the following link as an extra measure to safeguard your data: Do not sell my personal information.
The information on this website is the opinion of Up Capital Management and does not constitute investment advice or an offer to invest or to provide management services. Before purchasing any investment, a prospective investor should consult with its own investment, accounting, legal, and tax advisers to evaluate independently the risks, consequences, and suitability of any investment.
Copyright 2024 | Privacy Policy | Terms & Conditions