
BLOG

Recovery Rally Building Momentum
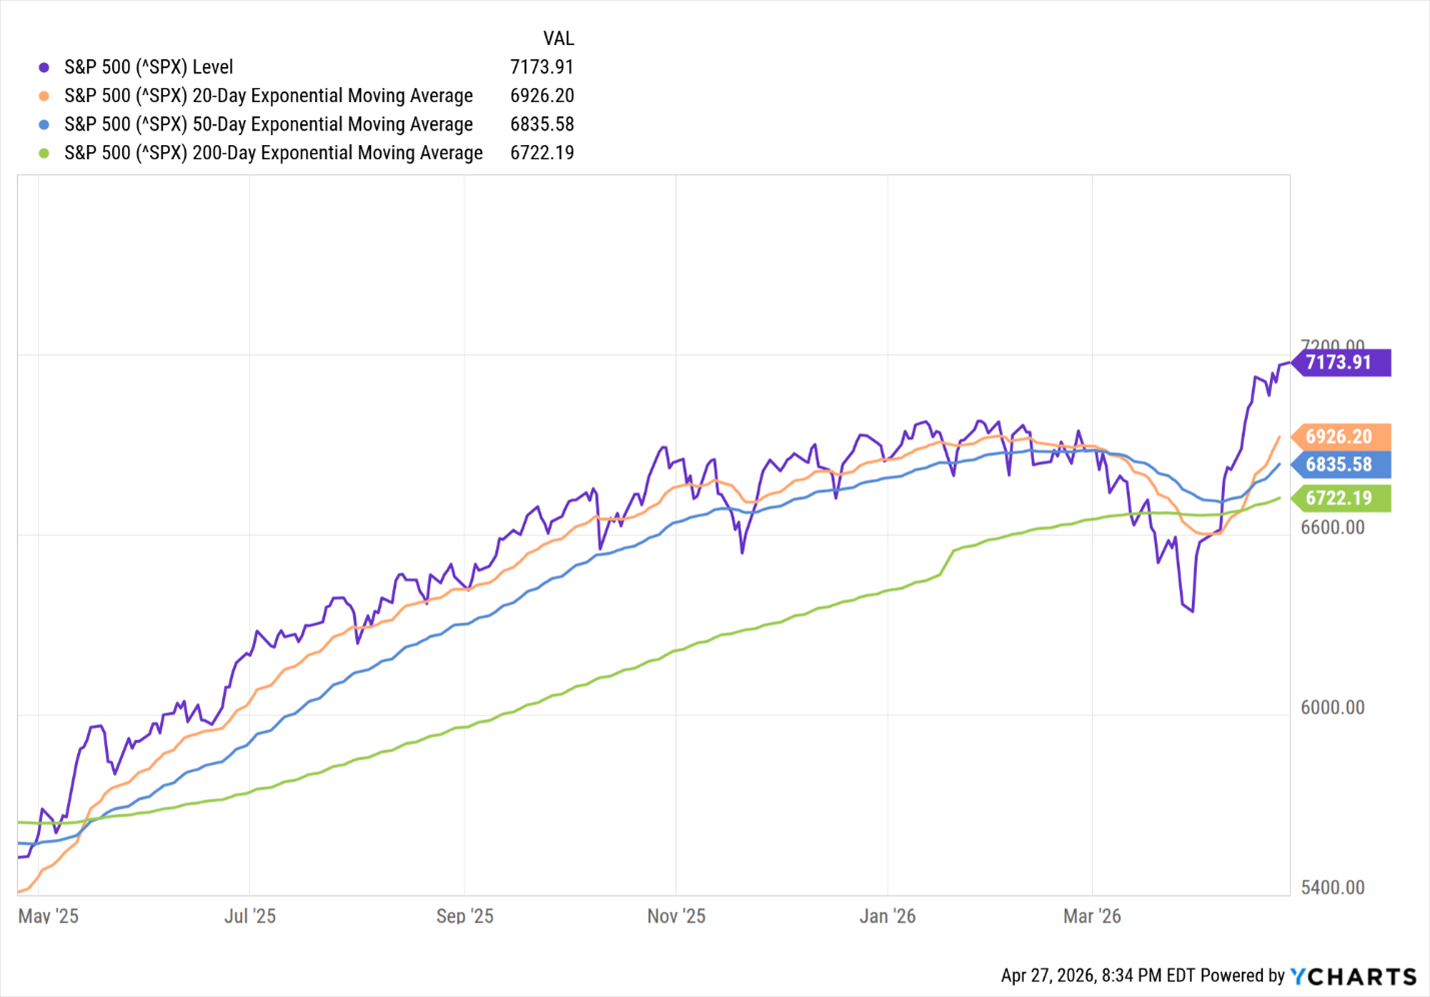
Most major U.S. market indices have staged an impressive rebound since establishing their lows on March 30, 2026. The S&P 500 has now moved back into a technically solid bullish trend, with its 20-day, 50-day, and 200-day moving averages all turning higher. This is an important indication that both short-term momentum and longer-term market direction have shifted back in favor of the bulls.
Leading the advance has been the NASDAQ Composite, which has surged 19.63% since March 30, while the S&P 500 has posted a strong gain of 13.09% over the same period.
This broad recovery reflects a meaningful return of investor confidence following the first-quarter correction and suggests that institutional capital is once again moving decisively back into equities.
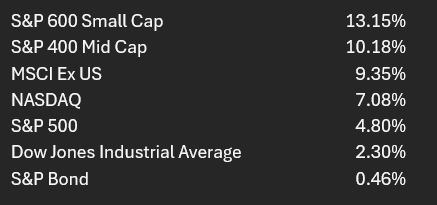
The other market averages have also turned decisively higher, also establishing a new positive uptrend since March 30, 2026.
Most notable has been the continued leadership of the S&P 600 since the fourth quarter of 2025, which remains the best-performing major U.S. index year to date.
As we have previously discussed, small-cap stocks have significantly lagged the larger market averages since 2018, leaving this segment with substantial catch-up and upside potential as investor attention rotates into under-owned areas of the market.
Equally encouraging is what this leadership shift suggests about investor behavior. Since late last year, institutional money appears to be broadening beyond the previously narrow concentration of mega-cap and technology stocks and moving into a more diversified mix of sectors and company sizes.
That broadening of investor portfolios is an important positive development. It indicates that this rally is being supported by a healthier and wider base of stocks rather than relying solely on a handful of dominant names. In our view, that improves the probability that the current advance can continue through the balance of the year and reflects a more constructive, risk-on appetite across the overall market.
Equally noteworthy is the unusual lag in the NASDAQ Composite. After years of dominating market returns, NASDAQ is not only failing to lead in 2026 but is trailing the S&P 600 by nearly 50% on a relative performance basis. That is a significant change in institutional buying and further evidence that institutional investors are diversifying their portfolios. This will reduce the concentration and dependence on large technology names that have carried the bull market since 2020.
Below are the year-to-date performance comparison and chart of these major market indices:
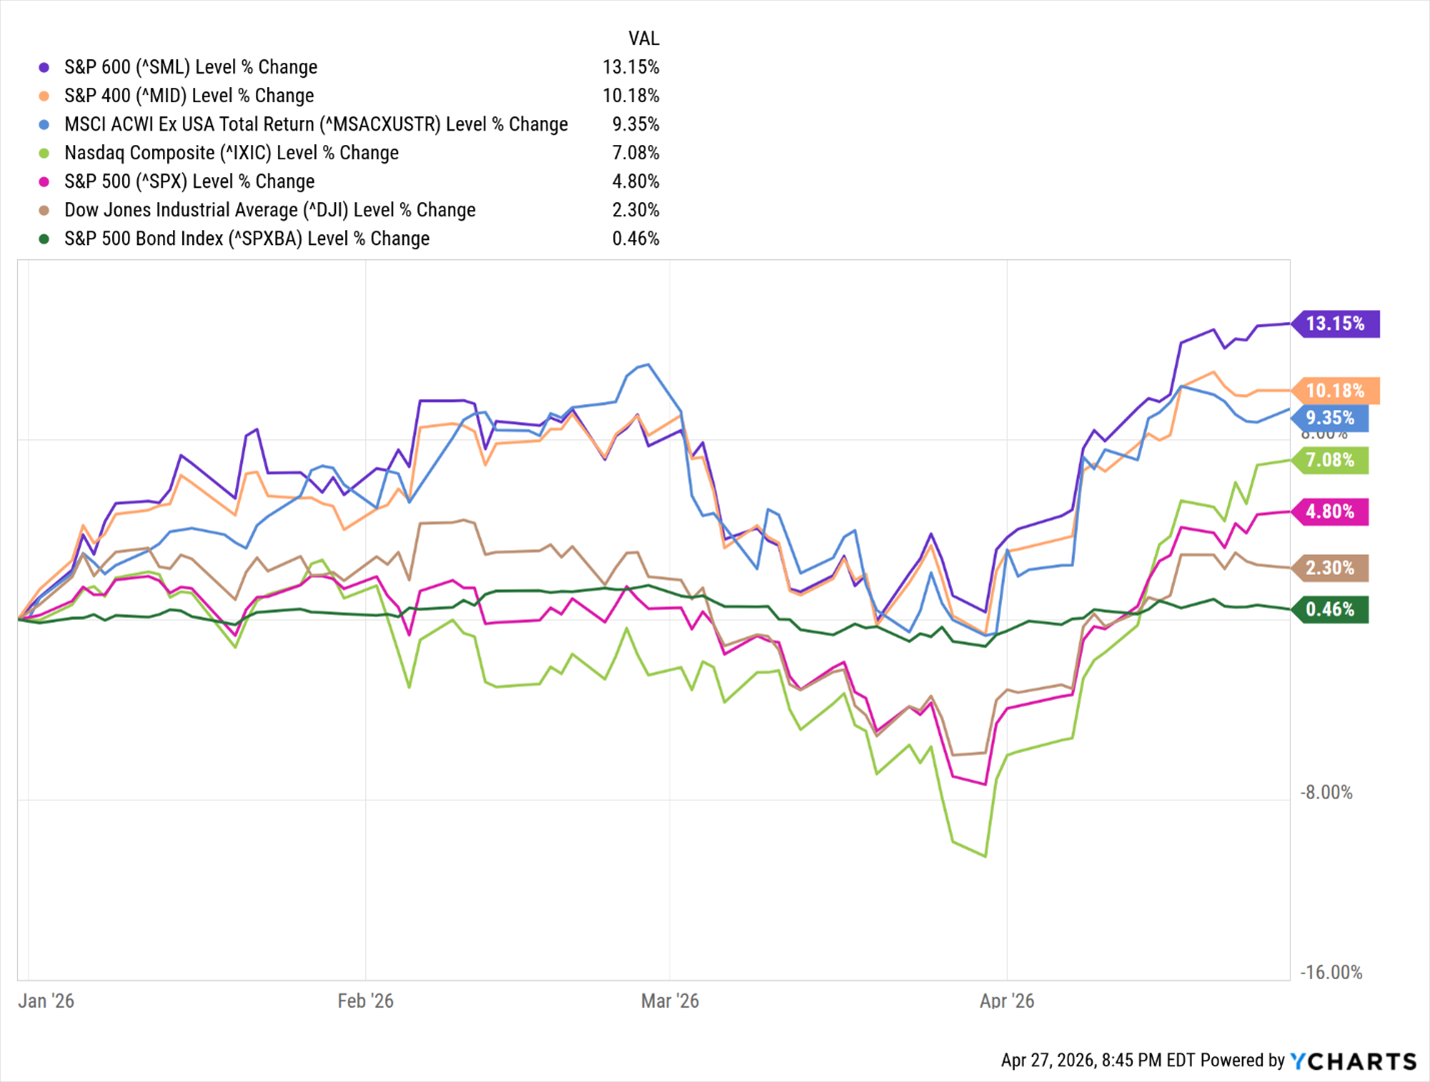
The stocks of the “Magnificent 7” that include Apple (AAPL),Amazon.com(AMZN), Alphabet (GOOGL), Meta Platforms (META), Microsoft Corporation (MSFT), NVIDIA (NVDA), and Tesla (TSLA) are showing a notably wide divergence in investor support so far this year.
Within this influential technology cohort, year-to-date performance spans from a loss of 15.88% in TSLA to a gain of 16.09% in NVDA. The range of these stocks’ changes YTD is an indication that institutional money is becoming more selective. We would anticipate greater stock volatility leading up to and following quarterly earnings reports, as expectations are rising for continued outsized quarterly earnings.
Most notable has been the renewed resurgence in NVDA. Investor enthusiasm for NVDA appeared to be cooling after November 2025, but that hesitation has given way to a fresh and meaningful wave of buying in recent weeks. NVDA is now up 16.09% year to date and an impressive 30.08% since March 30.
Close behind are AMZN, up 29.91% since March 30, and GOOGL, up 28.11% over the same period, while AAPL, MSFT, and TSLA continue to post negative returns for the year.
This uneven performance tells an important story: investors are no longer buying the Magnificent 7 as a uniform basket, but are instead rewarding those companies where earnings visibility, AI monetization, and growth durability remain strongest. We continue to maintain a highly favorable outlook on NVDA and currently hold a significant position in our growth portfolios. See the chart below.
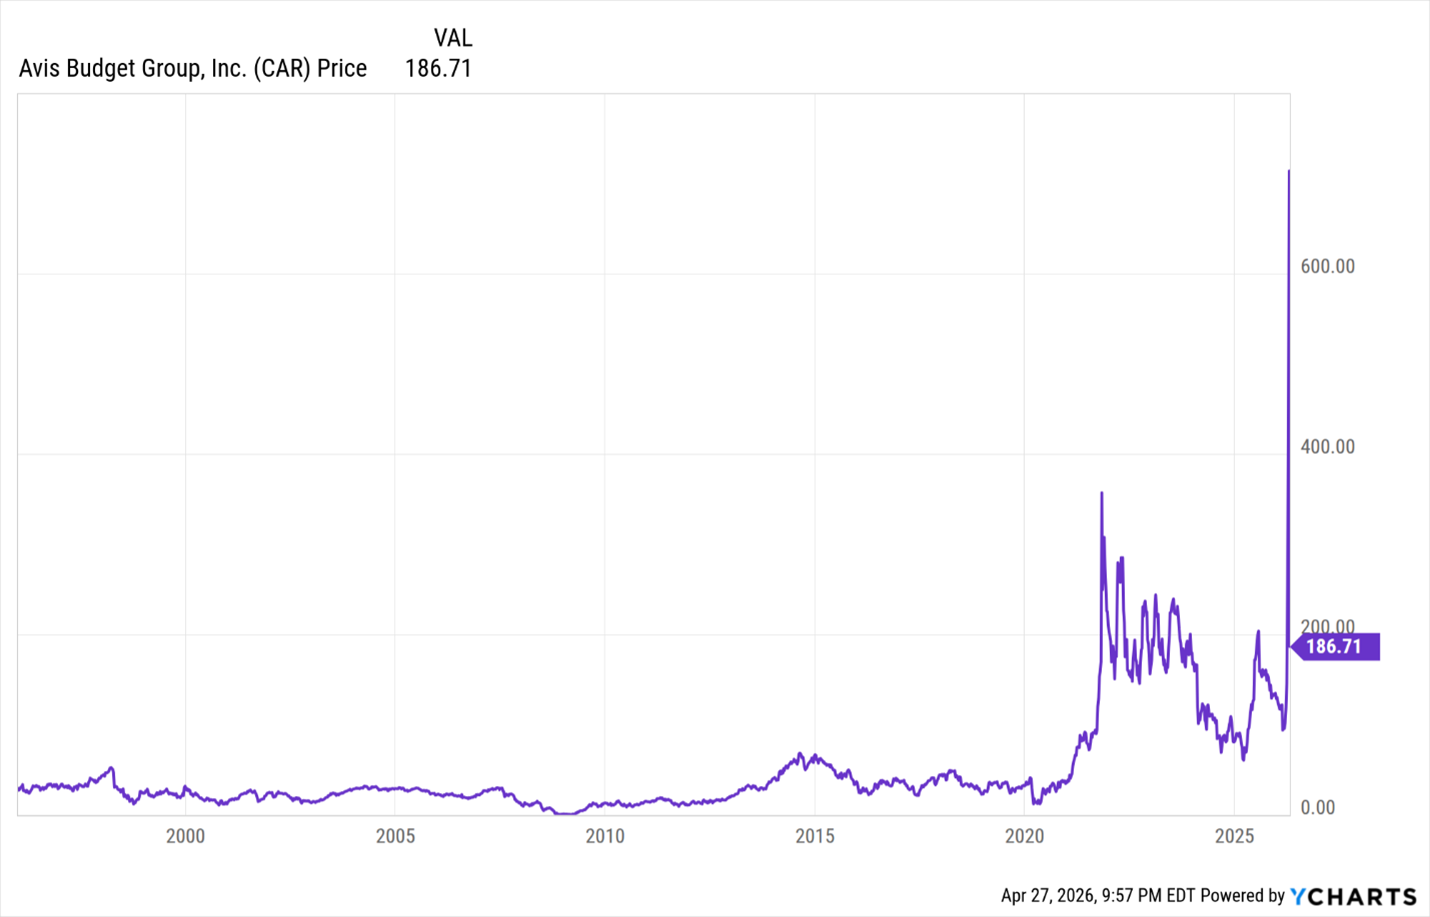
In case you missed it these past few weeks (you probably did), Avis Budget Group (CAR) became Wall Street’s newest meme-stock spectacle.
The stock launched into a breathtaking 53-day ascent, driven largely by an extreme buildup of short interest from investors aggressively betting the shares would decline. When CAR unexpectedly began moving higher, those short sellers were forced to buy shares to close their positions and limit mounting losses. Traders refer to this as a short squeeze when sellers are squeezed into buying as losses accelerate faster than they can escape.
Apparently unbeknownst to these short-selling traders, hedge funds SRS Investment Management and Pentwater Capital had accumulated enormous positions in CAR. Together, they reportedly controlled more than 70% of the company’s outstanding shares outright, and some analysts believe that when swaps and options exposure were included, the hedge funds had trading control that may have exceeded the amount of stock freely available for public trading. This was great news for SRS Investment Management and Pentwater Capital, but bad for the short-selling clients desperately needing to buy stocks to close their short positions. In other words, just as a growing army of short sellers desperately needing shares to buy back, there were very few shares available to purchase.
The result was a classic supply-and-demand dislocation. CAR exploded from $95.71 on March 1 to an intraday high of $847.70 on April 21. Once the imbalance between forced buyers and willing sellers began to normalize, CAR reversed course like a rocket running out of fuel, plunging back toward earth and closing today at $185.71.
What is less clear is why traders built such a lopsided short position in the first place.
Historically, CAR has been a market laggard. From 1996 through early 2020, the stock has had no meaningful gain. Then came the extraordinary consumer panic of 2020, when Americans rushed to buy everything from toilet paper to used cars. Vehicle shortages sent automobile prices soaring, with many dealers adding 50% to 100% premiums above MSRP (manufacturer’s suggested retail price). Rental car companies suddenly found themselves sitting on fleets of highly appreciated vehicles and enjoying unusually strong pricing power.
Investors took notice. CAR surged from roughly $16 in April 2020 to $357 by November 2021. An astonishing move.
But as the tidal wave of post-pandemic consumer demand receded, used-car prices normalized, rental fleet economics softened, and CAR’s share price gradually sank back toward the $100 range where it traded for much of this year.
That stagnation likely emboldened short sellers for what looked like a safe bearish trade. That was if SRS Investment Management and Pentwater Capital had not built an unusual concentration of ownership. They reduced the float of publicly traded shares of CAR that turned into one of the most dramatic squeezes of 2026 (so far).
During CAR historical rise, it became the most heavily weighted stock of the Dow Jones Transportation Index (DJT) and pushed the DJT to new closing all-time highs. Without CAR, DJT would still be at new closing highs, but just barely.
What Does This Mean to Me?
Our objective in managing our model portfolios is straightforward: to deliver competitive market returns that help our clients achieve their long-term financial goals. We are not day traders or looking to bet on the next meme stock.
What we strive to accomplish is to continuously identify high-quality stocks and sector ETFs that are demonstrating a positive uptrend. Once identified, we selectively add them to our model portfolios, ideally on days when individual stocks or the broader market experience weakness. Rather than reacting emotionally to short-term volatility, we use market pullbacks as opportunities to build positions in assets that continue to show strong long-term technical and fundamental leadership.
Since the pandemic, this disciplined approach has allowed us to capitalize on several exceptional buying opportunities created by market declines of 20% or more, including:
March 26, 2020- bottom of pandemic selloff
March 2023- near the bottom of the selloff due to the Federal Reserve rate hike campaign
April 10, 2025- bottom of selloff due to Trump’s tariff liberation day
April 1, 2026– bottom of selloff due to the Iran war
We maintain a favorable outlook on the US economy and stock market.
This week is an extraordinary week of earnings reports by mega companies that include GOOG, MSFT, AMZN, META, AAPL, Eli Lilly (LLY), Mastercard (MA), Caterpillar (CAT), and Berkshire Hathaway (BRK.A and BRK.B) – first time not by Warren Buffett.
Important economic data released this week includes the Q1 US GDP, consumer personal consumption, and consumer confidence.
Lastly, Jerome Powell, as the Federal Reserve Chairman, will be overseeing potentially his last Federal Reserve's Federal Open Market Committee meeting that will be followed by his speech on Wednesday outlining the committee’s rate policy.
Let us know if you have any questions about this UPdate. More importantly, give us a call to discuss your financial plans and how we may be able to assist you and your family in achieving your goals.

CONTACT
Check the background of your financial professional on FINRA's BrokerCheck.
The content is developed from sources believed to be providing accurate information. The information in this material is not intended as tax or legal advice. Please consult legal or tax professionals for specific information regarding your individual situation. The opinions expressed and material provided are for general information, and should not be considered a solicitation for the purchase or sale of any security.
We take protecting your data and privacy very seriously. As of January 1, 2020 the California Consumer Privacy Act (CCPA) suggests the following link as an extra measure to safeguard your data: Do not sell my personal information.
The information on this website is the opinion of Up Capital Management and does not constitute investment advice or an offer to invest or to provide management services. Before purchasing any investment, a prospective investor should consult with its own investment, accounting, legal, and tax advisers to evaluate independently the risks, consequences, and suitability of any investment.
Copyright 2024 | Privacy Policy | Terms & Conditions