
BLOG
Inflation is Down and Tariffs are Up?
To determine the future costs of consumer goods, one needs to monitor the costs to producers. If producer costs go up, then it is only a matter of time until your costs increase at the retail level.
Last week, there were several reports on changes in producer price costs. The Bureau of Labor Statistics released the US Producer Price Index (PPI). The index dropped in August to an annualized rate of 2.60% Year over Year (YoY). This is compared to last month, with 3.06% YoY, and last year at the same time, it was 2.07% YoY. The long-term annualized average increase of the PPI index going back to March 2011 is 2.61% and slightly above last month’s report. Except for the period of February 2021 to March 2022, the PPI annual changes have remained in a modest range, providing reasonable stability for the US economy.

The equity value of stocks in the S&P 500 has significantly outperformed the cost of goods for US producers over the same period. Since March 2011, the cumulative increase in goods is -0.12% inflation-adjusted compared to the cumulative increase of 459.7% in the value of companies in the S&P 500. This is a key for investors and consumers to stay ahead of inflation and build wealth, as the value of American companies that invent, manufacture, create, and distribute goods has outpaced the cost of goods.

The PPI excluding food and energy is not very different. For August, the annualized PPI Excluding food and energy increased 2.83% compared to July of 3.40% and at the same time last year the annual increase rate was 2.83%. The long-term annualized average of PPI Ex food and energy is 2.64%. Again, except for the 2021 and 2022 period, the cost of goods excluding food and energy has been moderately stable for the past 23 years since the Bureau started publishing the PPI Ex food and energy.

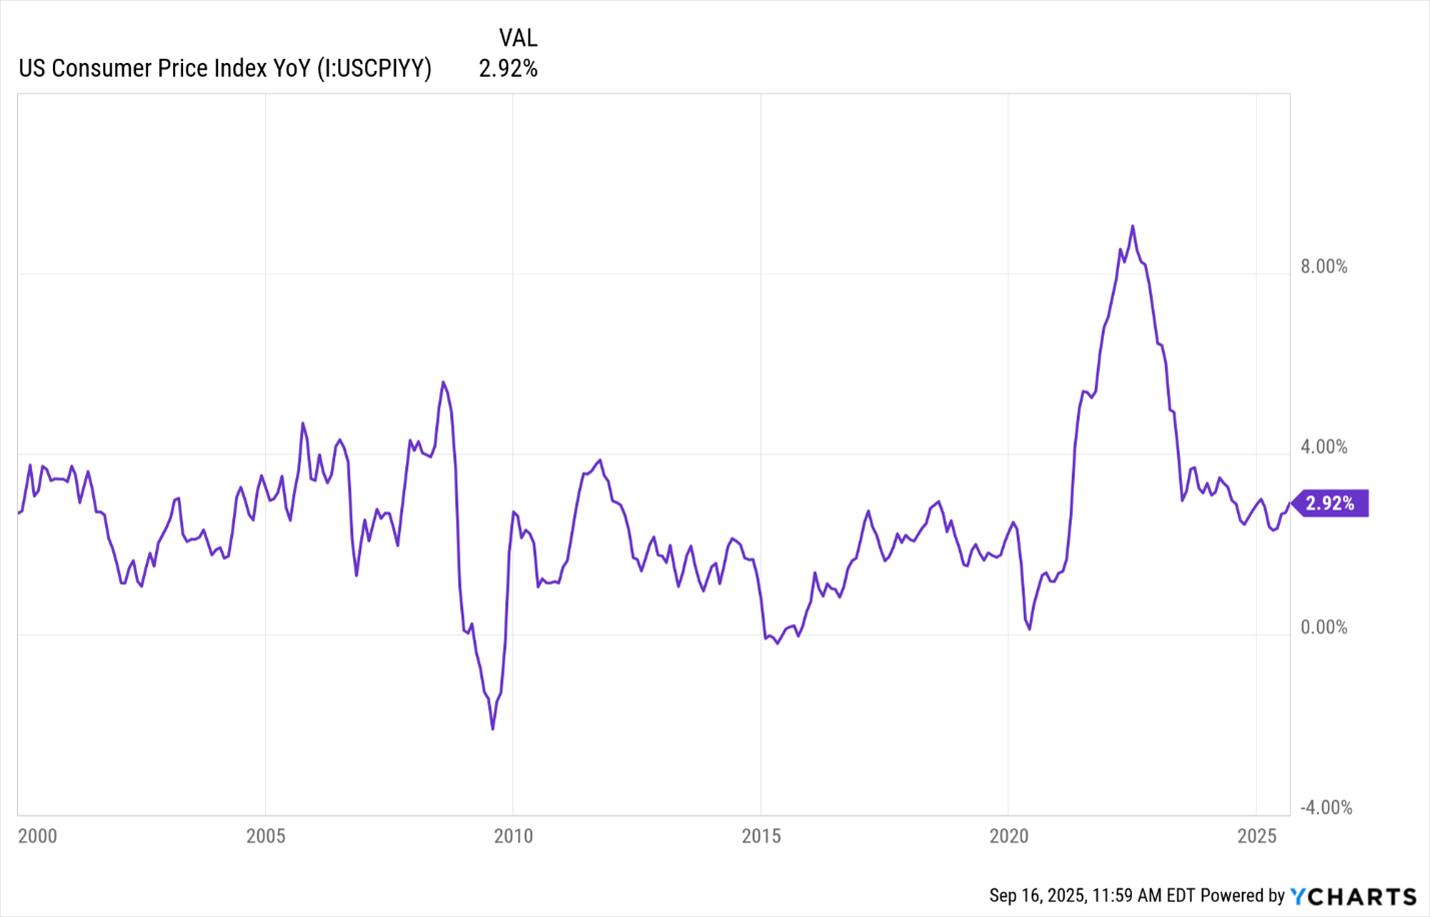
The change in retail costs to consumers is predictably also stable. The closely watched Consumer Price Index (CPI) YoY increased on an annualized basis to 2.92% in August. This is above the Federal Reserve’s target rate but well below the nearly 9% annualized increases the CPI reached in early 2022.
This is welcoming news for the Trump Administration and the Federal Reserve. Pundits on major networks and social media have been messaging the dire risk of tariff-induced hyperinflation, possibly leading to a recession. So far, this has not been the case. Since May, national firms have been announcing their projections for no changes in their retail pricing due to the tariffs. That’s not to say prices may go up for other reasons, just not solely due to tariffs. Nonetheless, annual price increases are well within the past 20-year average.
Ironically, investors were not very receptive to all this good news last week. Good news is bad news again. Investors are looking for the Federal Reserve to drop the discount interest rate this Wednesday, and the primary motivator for the Fed to act will be indications of rising inflation and unemployment. Neither indicator is turning negative.
However, despite the apparent healthy status of the US economy, analysts still project a near 100% chance the Fed will reduce rates this Wednesday. Maybe due to President Trump’s insistence, or the Fed is concerned about a slowing economy. The two key events on Wednesday are whether the Fed reduces rates and the follow-up speech by Jerome Powell after the Federal Open Market Committee (FOMC). Investors hope for a rate reduction and indications in Powell’s speech of subsequent cuts later this year.
If one or both occur, expect more tailwind in the current stock market rally and especially in technology and growth sectors. Lower interest rates offer opportunities for companies to refinance higher-interest-rate loans and originate new loans for capital expansion. Interest rates on construction, bridge loans, and corporate debt have declined substantially this past year, while home mortgage rates have held steady in the high 6% range.
Remember that when the Federal Reserve lowered its discount rate twice last year, mortgage rates increased slightly. Hopefully, home mortgage rates follow a Fed rate cut going into the fall and spring of 2026.
What Does This Mean to Me?
The US stock market rally that started on April 9 has slowed a bit since September 9. The performance line-up of the major indices hasn’t changed this year. The MSCI Ex US took the lead after rumors of Trump tariffs and continued to lead the US major indices to date. However, since September 1, the MSCI has increased 3.72% from a 22.19% YTD gain to yesterday’s 25.91% YTD gain. NASDAQ has increased 4.65% from an 11.11% YTD gain to yesterday’s 15.76% YTD gain. The increase of the S&P 500 was slower at 2.49% increase.

For the year, the MSCI Ex US is the frontrunner in best performance YTD so far. This is the first time in more than 25 years that the foreign index has led the SP 500 and NASDAQ. This is an example of why watching laggards in the market is important, as some can become leaders, if not briefly. We have maintained a 100% US-based portfolio primarily due to the underperformance of the foreign markets. That’s not to say that certain countries have had short-term superior performance, just not a sustainable, definable trend.
It is why we watch and report on the SP400 (mid-cap) and SP 600 (small-cap). Both have significantly underperformed the SP500 and NASDAQ, but based on past experiences, both these underperforming indices and their sector will be top gainers in the future. However, the momentum remains with the large company growth, especially in the technology sector.
The gold and silver sectors have also had stellar gains this past year. We started adding gold miners to our portfolios earlier this year and increased allocations in August. The silver sector has been lagging gold, and as a result, we have held off adding any silver stocks. The precious metals market is a momentum play and difficult to navigate as metals do not produce income, dividends, or revenue. It is simply a great fool market. Meaning you bought at one price in hopes a greater fool will buy at a higher price. This game works so long as more fools enter with their hard-earned money, paying higher and higher prices. The game is over when everyone leaves.
For now, the momentum is positive. Our explanation for the rally in gold and silver prices is related to the lowest consumer sentiment in 72 years. I bet the Consumer Sentiment index, if monitored 100 years ago, would be higher during the Great Depression than it is today. The negative messaging by major networks, news media, and social media is overwhelming. This low sentiment, while the largest segment of Americans are working, and many are building their wealth. No food lines, massive number of starving households, no devastating social government programs to get “America Working Again”, or hyper-inflation and 70% tax rates on those that are working (maximum tax rate of 92% imposed by President Kennedy).
For the past 12 months, the gold and silver stocks I monitor have significantly outperformed NASDAQ and the other major US stock indices. This has been a trend for a while, with 50% of the group outperforming NASDAQ for the past 5 years and 80% of the group for the past 10 years. However, looking at long-term trends does not reveal the boom-bust periods of the metal market. For example, US Gold Corp (USAU) has gained 159% for the past year but only 32.8% for the past five years. We continue to mine (pun in memory of Louis Rukeyser of Wall Street Week) metal stocks for the growth portfolios to complement the technology and large-cap sectors.

CONTACT
Check the background of your financial professional on FINRA's BrokerCheck.
The content is developed from sources believed to be providing accurate information. The information in this material is not intended as tax or legal advice. Please consult legal or tax professionals for specific information regarding your individual situation. The opinions expressed and material provided are for general information, and should not be considered a solicitation for the purchase or sale of any security.
We take protecting your data and privacy very seriously. As of January 1, 2020 the California Consumer Privacy Act (CCPA) suggests the following link as an extra measure to safeguard your data: Do not sell my personal information.
The information on this website is the opinion of Up Capital Management and does not constitute investment advice or an offer to invest or to provide management services. Before purchasing any investment, a prospective investor should consult with its own investment, accounting, legal, and tax advisers to evaluate independently the risks, consequences, and suitability of any investment.
Copyright 2024 | Privacy Policy | Terms & Conditions