
BLOG

Imports and Exports Costs Declining
Last week, we reviewed the changes in prices from manufacturers and producers. Based on the reports from the US Bureau of Labor Statistics, the annual increase of the Producer Price Index (PPI) declined in August to 2.6% year-over-year (YoY) compared to July’s YoY annualized rate of 3.06%. The long-term annualized average increase of the PPI index going back to March 2011 is 2.61% and slightly above last month’s report. Except for the period of February 2021 to March 2022, the PPI annual changes have remained in a modest range, providing reasonable stability for the US economy.
Today, we will look further into the supply chain processes and the cost changes of imports to our US producers. We will also look at export costs to our foreign partners, as the changes will eventually impact US companies.
First, we will look at the import costs that will have a direct impact on the US inflation and consumer price index. The US Bureau of Labor Statistics released this morning the US Import Price changes of its index. The index increased 0.3% to 141.4 points in August, but the index is down from the start of the year at 141.8.

After the surge in costs from our foreign partners that peaked in June 2022 at 148.5, the costs of goods being imported into the US have declined significantly. June 2022 was the highest the index has reached since the Bureau has been tracking import costs. The previous peak was reached in July 2008 at 147.5.
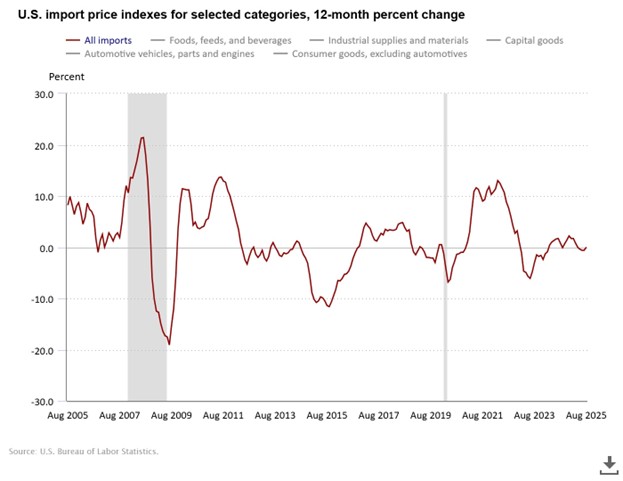
Below is a chart by the Bureau showing the annual increase in all costs of goods imported. As illustrated, the average annual increase of all goods imported peaked in March 2022 at 13.0% and then dropped to an annual decrease of -5.7% in May 2023. Since May 2023, annual changes in costs have been slowly rising, with August showing a flat 0.0% annual change.
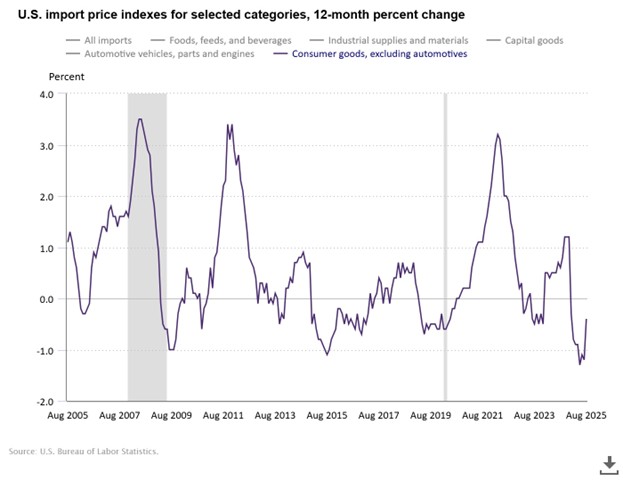
The Bureau provides informative charts that separate the cost changes of specific categories, as some categories are more impactful to households than others. The first chart is the US Import Price Index for Consumer Goods Excluding Automotive. As illustrated, the annual increase of imported Consumer Goods declined dramatically on an annual basis since the peak in March 2022. Then, overall costs had annual declines during 2023 and so far for all of 2025 (the gray bar indicates the recession period in the US).
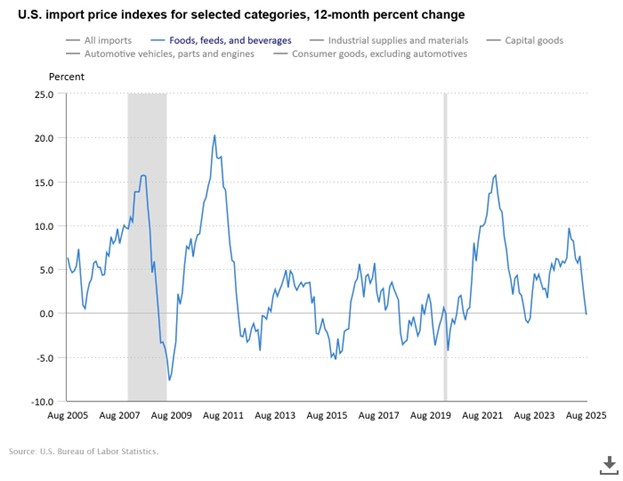
The next chart shows annualized changes of imported foods, feed, and beverages. Since May 2023, food costs have been increasing at an annualized rate from 5% to 10% which is nearly a 400% increase above the US CPI in 2023. These increases after huge annual increases experienced in 2020 to 2022 peaked at an annual rate of 15.7%. This may be part of the explanation for spikes in restaurant prices that have nearly doubled since 2020. However, import prices have declined dramatically, and in August the annual increase was 0%. Maybe an indication of retail food prices stabilizing soon.
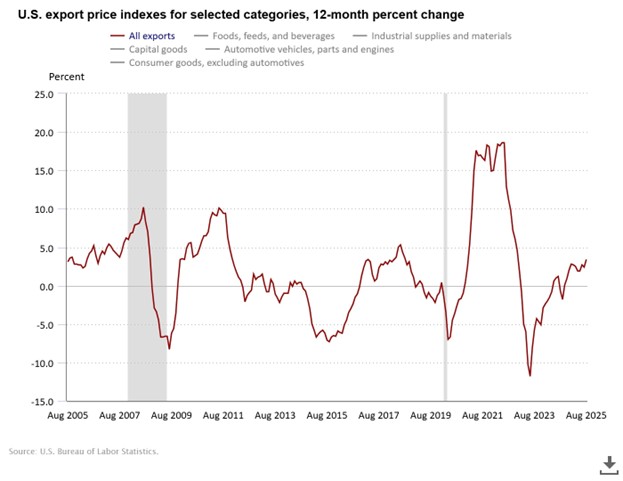
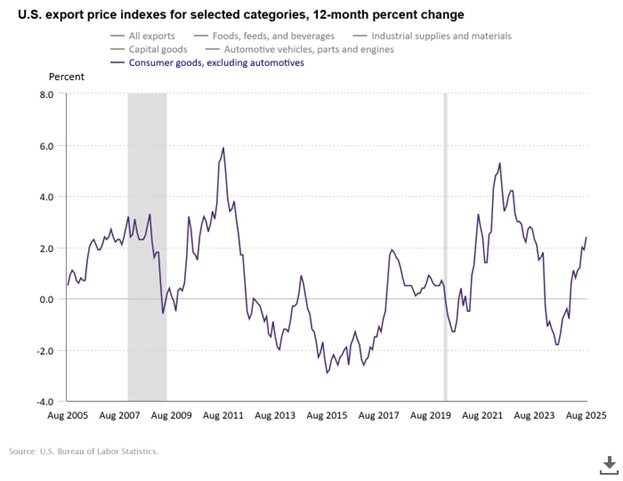
The commerce world is symbiotic in that as US cost rises, it eventually rotates to other parts of the world and then back to the US. Below is the annual change in export prices for all categories. US export prices have been significantly more volatile for our foreign partners. As US import costs peaked at an annual increase of 13.0%, annual increases of export prices peaked at 18.6% in June 2022. As import prices declined, so did export prices to similar negative annualized increases. The export annual increase for August 2025 was 3.4%.
Annualized costs of consumer goods exports have been increasing in 2025 compared to declining costs of imports.
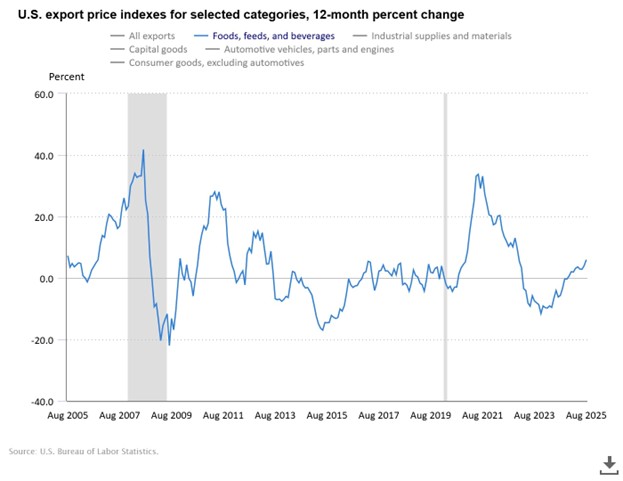
The annual change of exported foods, feed, and beverage categories has been significantly different than import costs. The US exports of foods peaked at an annual rate of 33.7% in June 21, which has taken two years for the annualized rate to slowly decline. From January 2023 to October 2024, the annualized change of costs was negative, with the bottom reached in November at -11.6%. Since November, export food costs have been rising, and for August, the annualized increase is 3.4%.
What Does This Mean to Me?
So far, import prices have not been meaningfully impacted by tariffs. As mentioned last week, costs from US producers to retail have been declining in 2025. Based on these reports last week and this week, it would be fair to say that prices are stabilizing in the US for the near future. Last Wednesday, the Federal Reserve, as widely expected, lowered its discount rate by 0.25%. The lower discount rate in a stable inflationary market should be good news for consumers and households. The residential and commercial real estate industry may see an improvement if mortgage rates also follow the discount rate down. Lower interest rates will be a bonus for US companies to lower their lending costs and provide additional capital for expansion.
Households should be less impacted if they have managed to keep their debt down. Unfortunately, credit card interest rates will probably remain sky high and a challenge for those with credit balances.
Nonetheless, the economy is stable, along with a growth trend in the US stock market. However, it is worth noting that, as in every growth cycle, there are winners and losers, with the winners significantly outperforming the overall market. The key to building wealth is owning winners and trimming out the losers. As an example, we have discussed in this UPdate, the continued underperformance of the S&P 400 (Mid-cap index) and S&P 600 (Small-cap index), along with the Russell 2000 (small-cap Value), compared to the S&P 500 (large cap index). However, the net return of US companies in the S&P 500 index trails the returns of the NASDAQ technology index. The chart below illustrates the net return for the past 12 months of these indices, which illustrates a distinct difference in returns:

If you have too high an allocation to stocks in the Russell 2000 or S&P 400 Mid Cap, your return would be 40% and 20% of those companies in the NASDAQ. Instead of a 25.77% return for the past 12 months, your returns would be 10.09% and 5.66%. The S&P 600 is up only 2.93% for the past 12 months, which is almost 50% of what you could earn in a 12-month Certificate of Deposit (CD) with no risk. It is imperative to constantly update your portfolio as institutional investors rotate in and out of sectors. If you miss this growth cycle, you will have considerably less account value to navigate through the next recession.
Give us a call if you have any questions about this UPdate or your account. We welcome the opportunity to assist you and your family with your financial planning.

CONTACT
Check the background of your financial professional on FINRA's BrokerCheck.
The content is developed from sources believed to be providing accurate information. The information in this material is not intended as tax or legal advice. Please consult legal or tax professionals for specific information regarding your individual situation. The opinions expressed and material provided are for general information, and should not be considered a solicitation for the purchase or sale of any security.
We take protecting your data and privacy very seriously. As of January 1, 2020 the California Consumer Privacy Act (CCPA) suggests the following link as an extra measure to safeguard your data: Do not sell my personal information.
The information on this website is the opinion of Up Capital Management and does not constitute investment advice or an offer to invest or to provide management services. Before purchasing any investment, a prospective investor should consult with its own investment, accounting, legal, and tax advisers to evaluate independently the risks, consequences, and suitability of any investment.
Copyright 2024 | Privacy Policy | Terms & Conditions